Calibration and Validation Data
What we have for testing the model, and what it can actually support
Overview
The MAGiC pipeline is used to generate inventory and projection estimates of SOC stocks and GHG emissions from California croplands.
The calibration and validation dataset combines two functionally1 independent bodies of evidence, and they do different jobs. These are
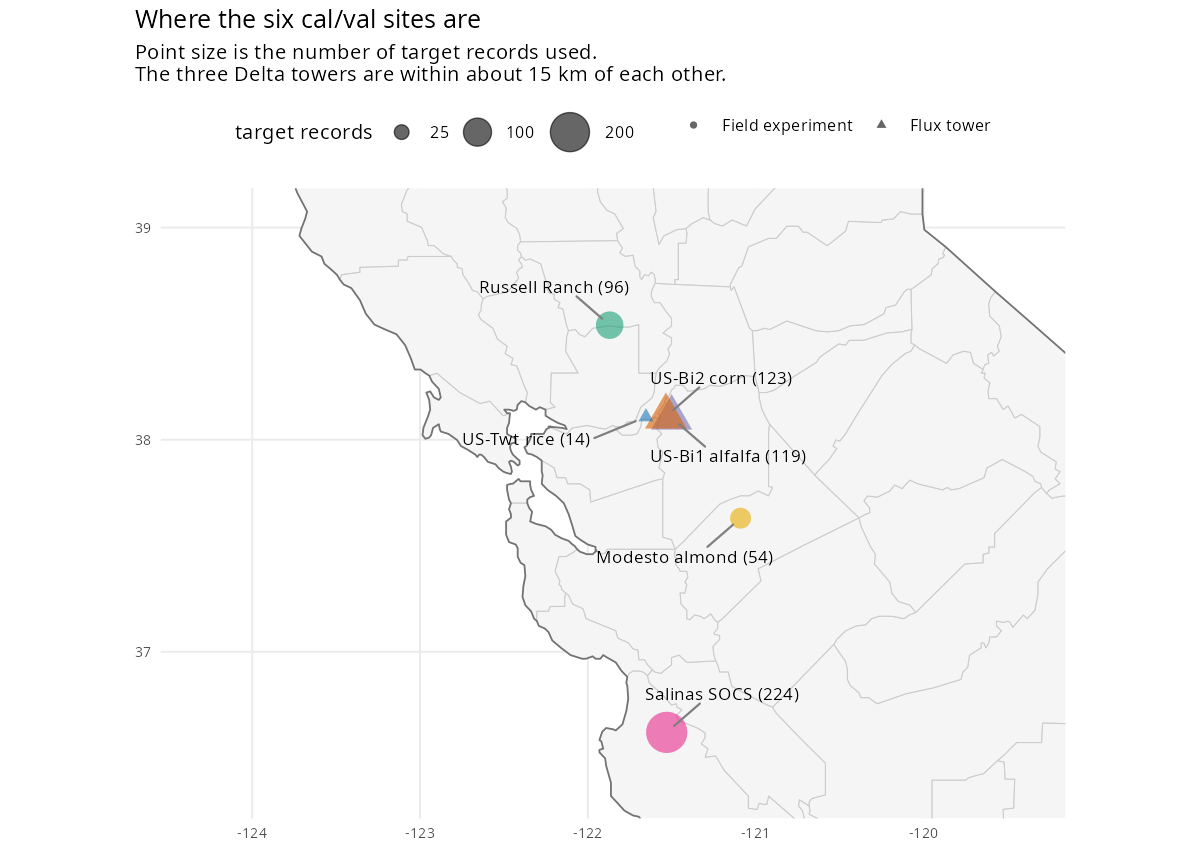
Site level data is six California fields where somebody measured soil carbon or a greenhouse gas flux. It answers a question about magnitude: does the model produce the right stock, the right flux, at a real place.
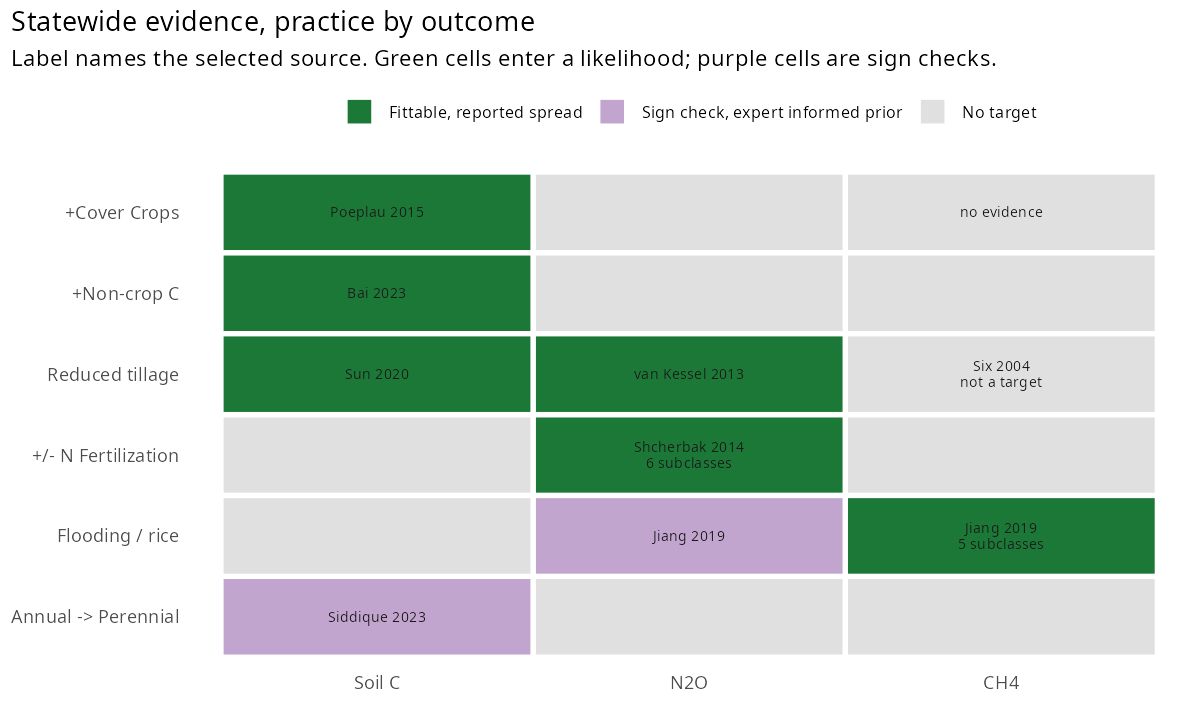
Synthesis evidence is a set of values from statistical synthesis of published literature on the impacts of sustainable farming practices on SOC and GHG balance. It answers a question about response: when a practice changes, does the model respond in a direction and rough magnitude that is consistent with available evidence.
Neither of these datasets is sufficient. The limited site-level dataset is insufficient for calibration because it is easy to overfit the model to specific sites while missing the big picture changes.
Key points
| Key point | Detail |
|---|---|
| Soil carbon and gas flux are measured at different sites. | Of the six sites, three include SOC stock measurements, and three provide gas exchange, and no site carries both. Any claim spanning both is an extrapolation, not a validated result. |
| Practice contrasts exist at only two sites, both annual crop soil sites. | There is no measured practice contrast anywhere in the Delta, and none for rice. |
| Six of the 18 statewide cells carry a spread and can be fitted, where a cell is one practice paired with one outcome. | They are cover crops, non-crop carbon and reduced tillage on soil carbon, reduced tillage on N2O, fertilisation on N2O, and rice drying on CH4. Two more have no published spread and are used to check the direction of the model response (B5). |
| Two caveats apply to the targets. | Salinas 2003 and 2004 are excluded as establishment effects, and US-Bi2 is a much larger net carbon source than its neighbour, a magnitude to confirm with the site team. Both are described in place. |
| Coverage and usability are not the same thing. | An empty cell indicates that no useable target was identified in the sources reviewed. |
The two bodies of evidence
Contents
| Page | What it covers |
|---|---|
| Part A: Site-Level Data | The six sites, when the measurements happened, coverage against the prepared run windows, what is measured and where, the soil carbon and flux records, and practice contrasts (A1 to A7) |
| Part B: Statewide Evidence | What the statewide evidence is for, the practice by outcome grid, why so few cells are fittable, how uncertainty is recorded, where the spread is an expert informed prior, and what is deliberately excluded (B1 to B6) |
| Part C: Using the Two Together | What each side constrains, how the evidence enters the likelihood, and reading this data honestly (C1 to C3), with the data held but not used as targets |
| Data Collection Protocol | Protocol for spreadsheet-based curation of published and archived datasets for crop model calibration and validation |
| Data Requirements (2024) | The datasets sought, as of December 2024, to evaluate the SIPNET ecosystem model’s simulation of agricultural management and biogeochemical cycling |
Footnotes
Large scale synthesis datasets may contain the same site level data, but we assume that the effect is small enough to be practically independent.↩︎