Biomass Atlas

Aboveground Biomass Under Management Scenarios

Author

Akash B V

Published

April 10, 2026

Aboveground biomass (AGB) represents the total mass of living plant material above the soil surface – stems, leaves, and reproductive structures. For annual crops, AGB is a snapshot of standing biomass at the modeled time point. Because these are harvested crops, end-of-season AGB values are typically small. See the Scenario Definition Table for practice parameters and simulation details.

Validation Status

These results are from a proof-of-concept modeling framework that has not been validated against field observations. Interpret all values as illustrative projections, not empirical estimates.

Context for AGB values

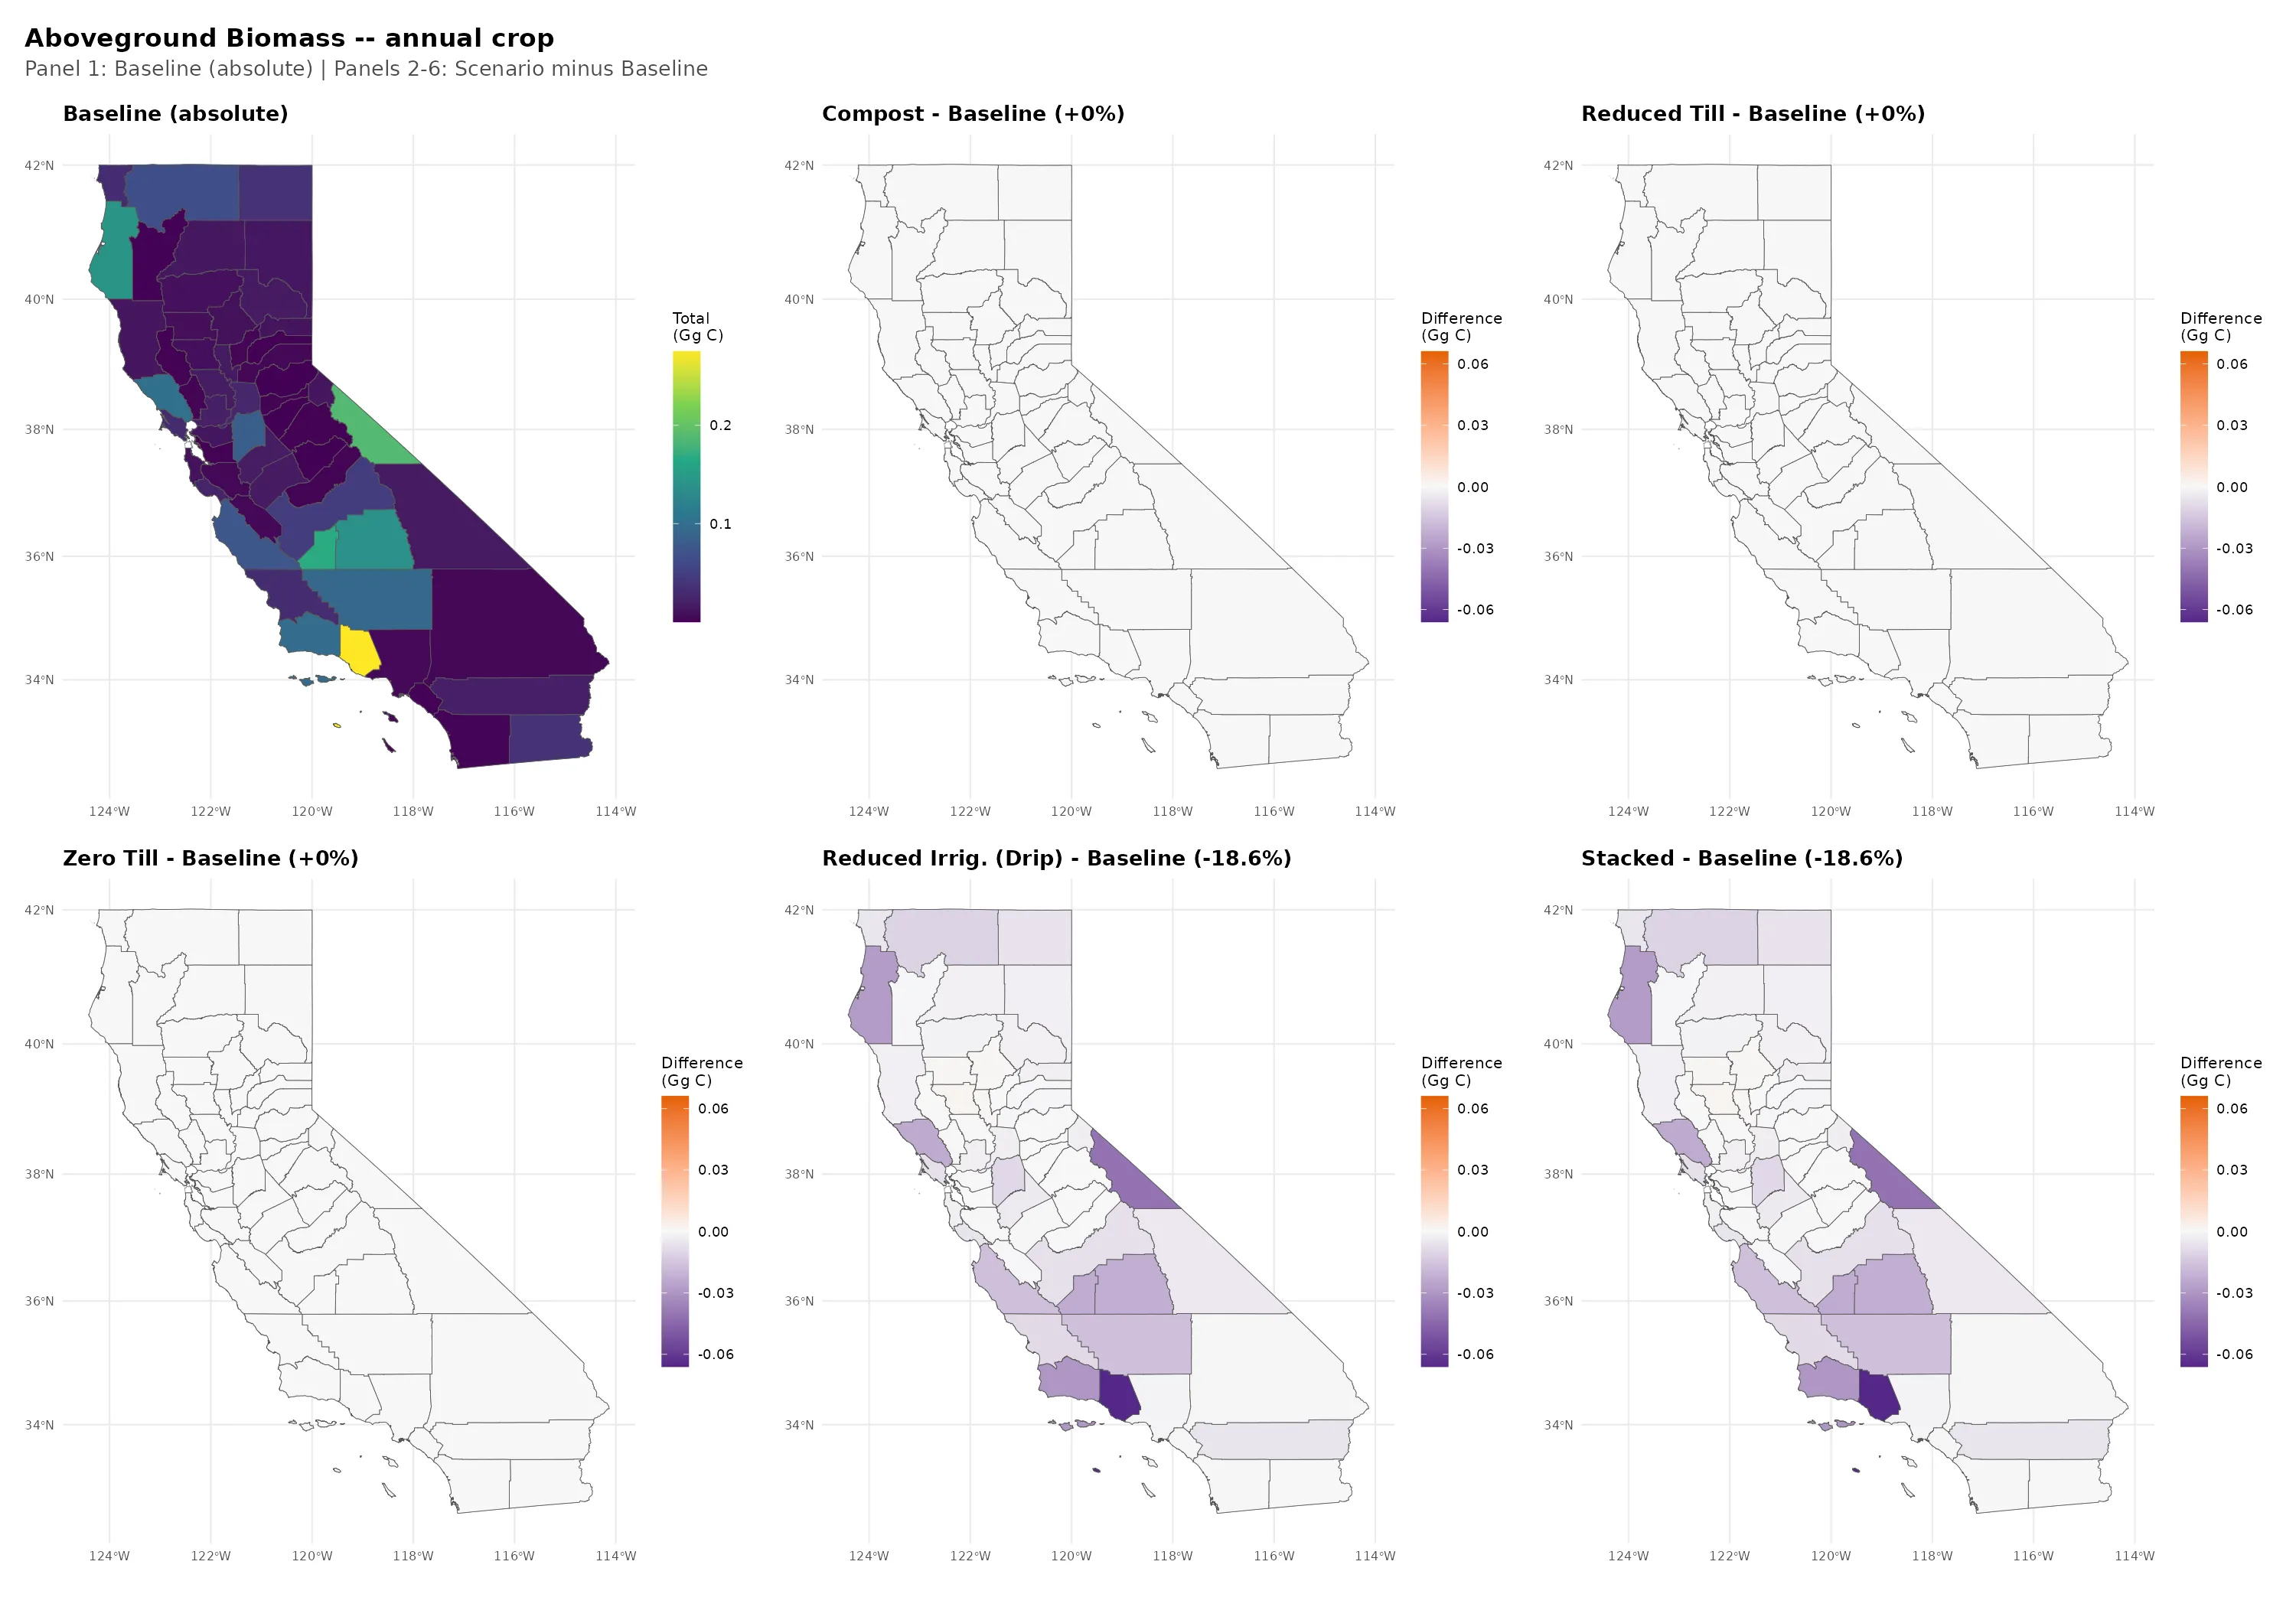
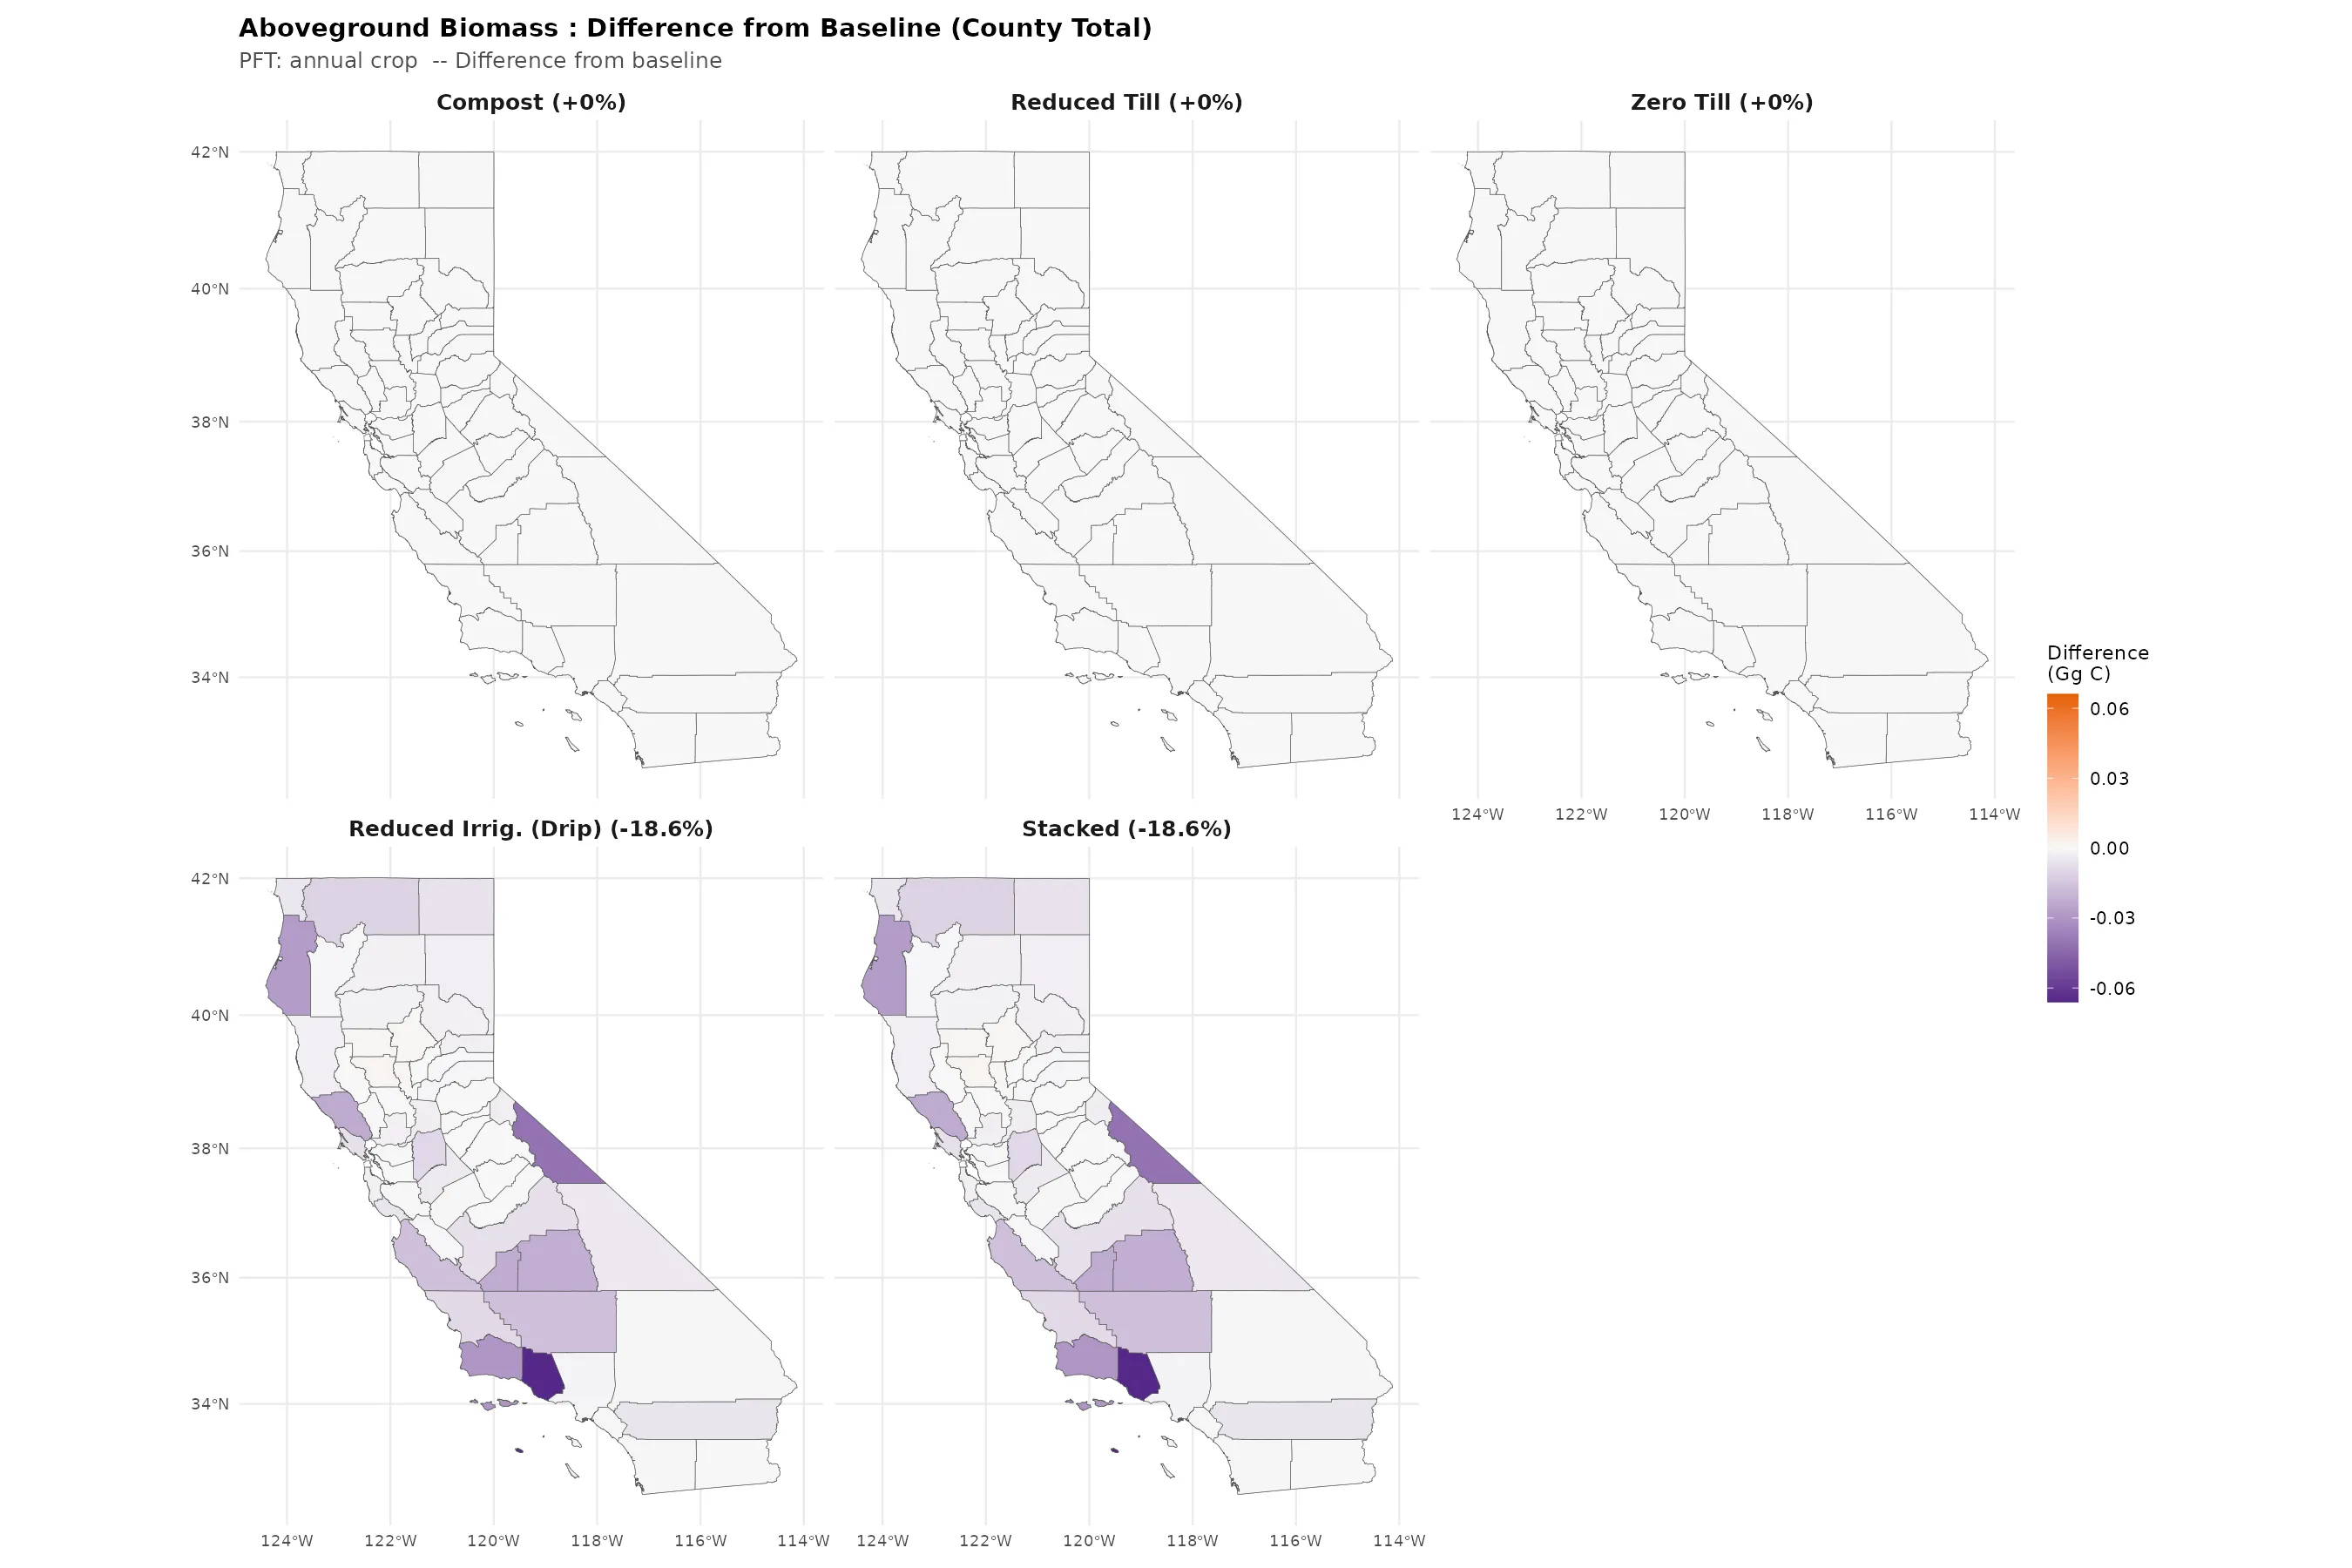
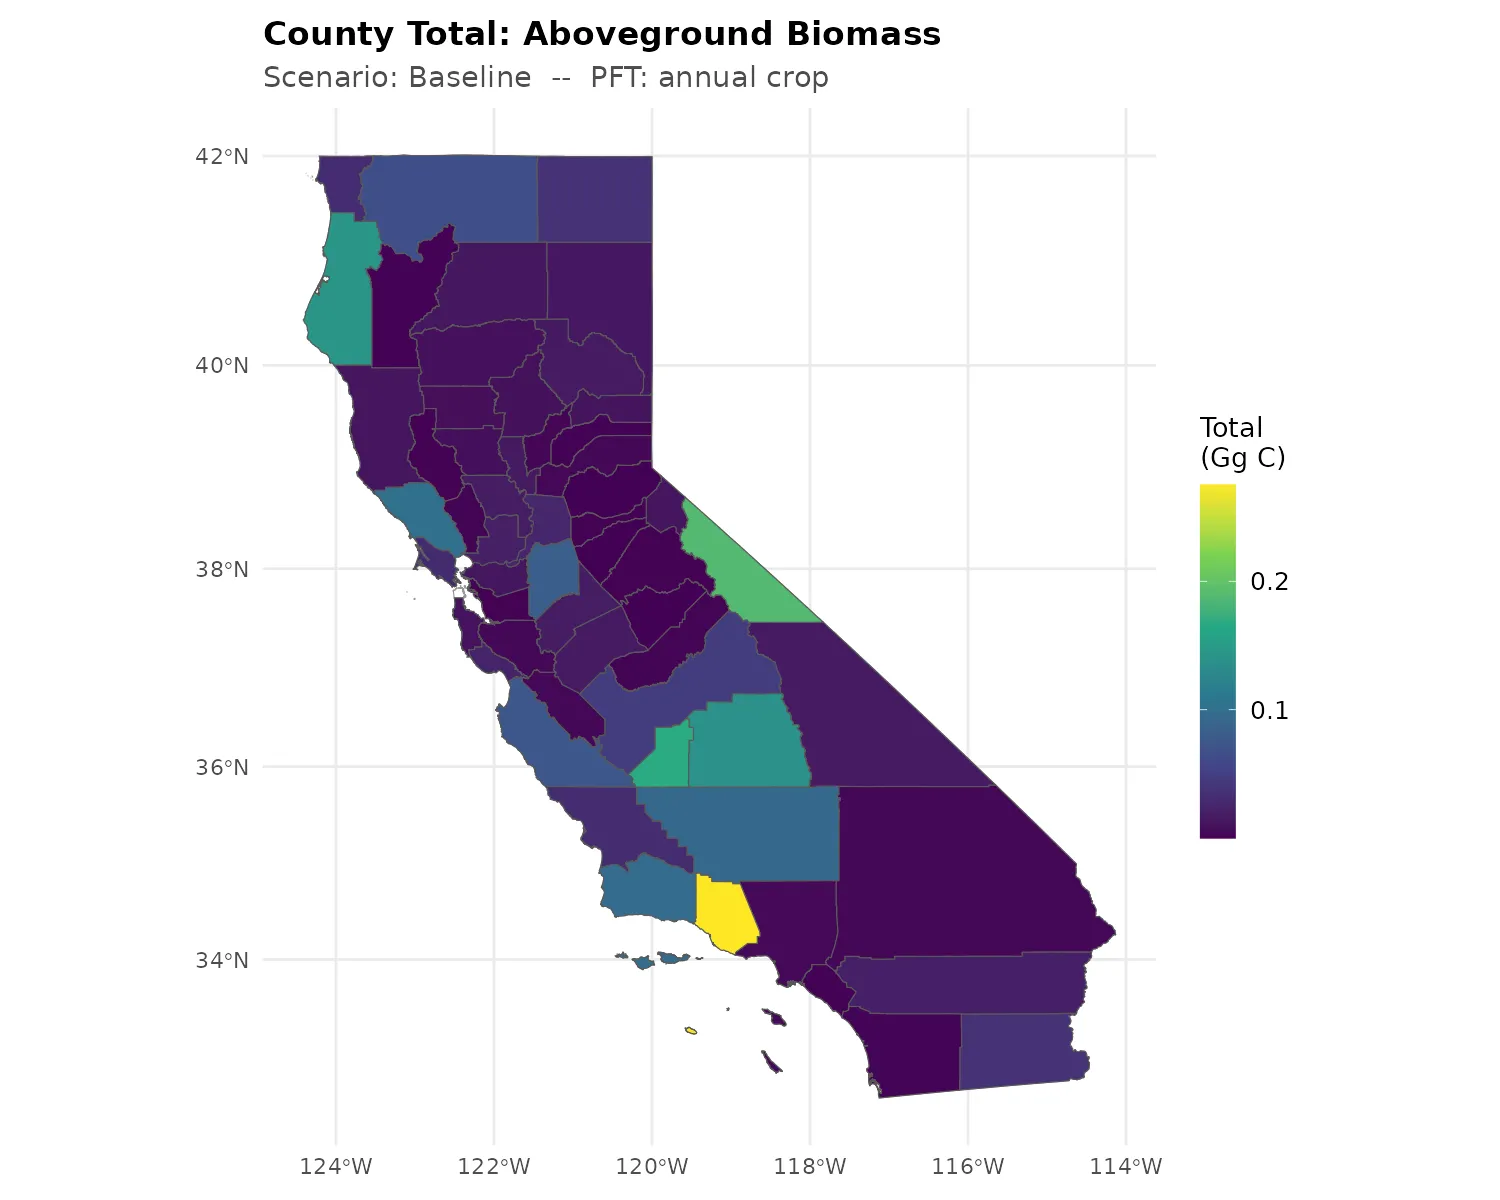
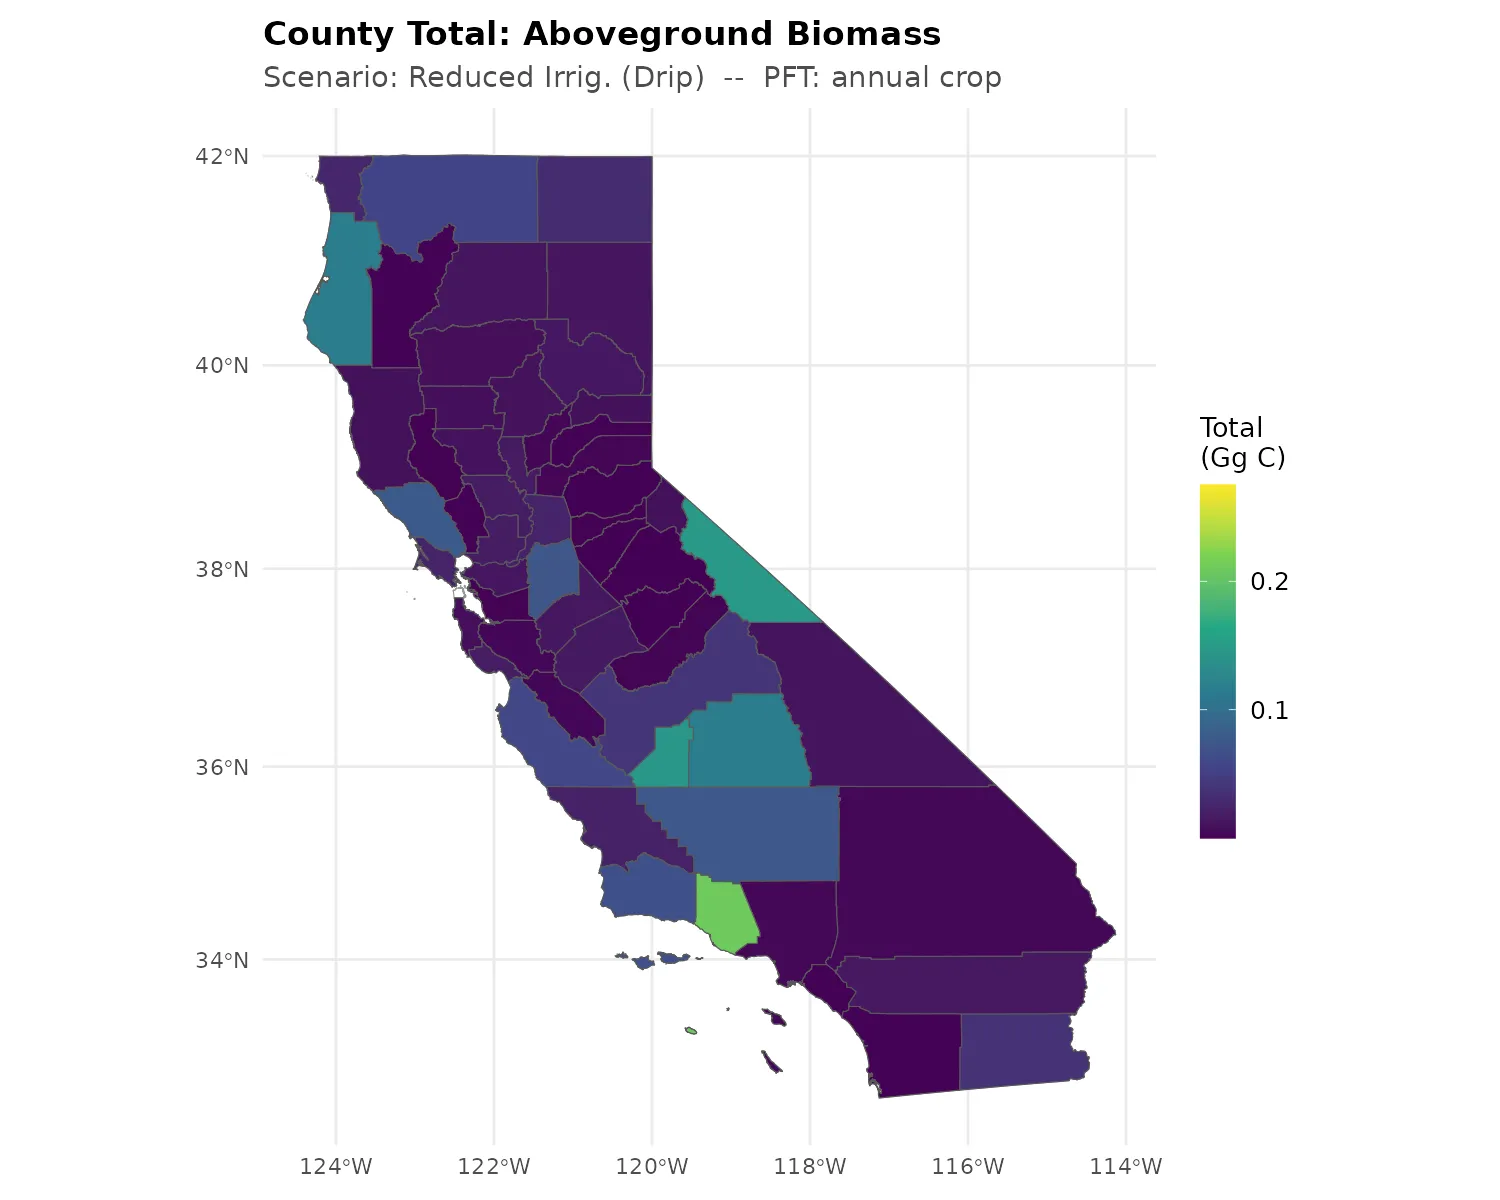
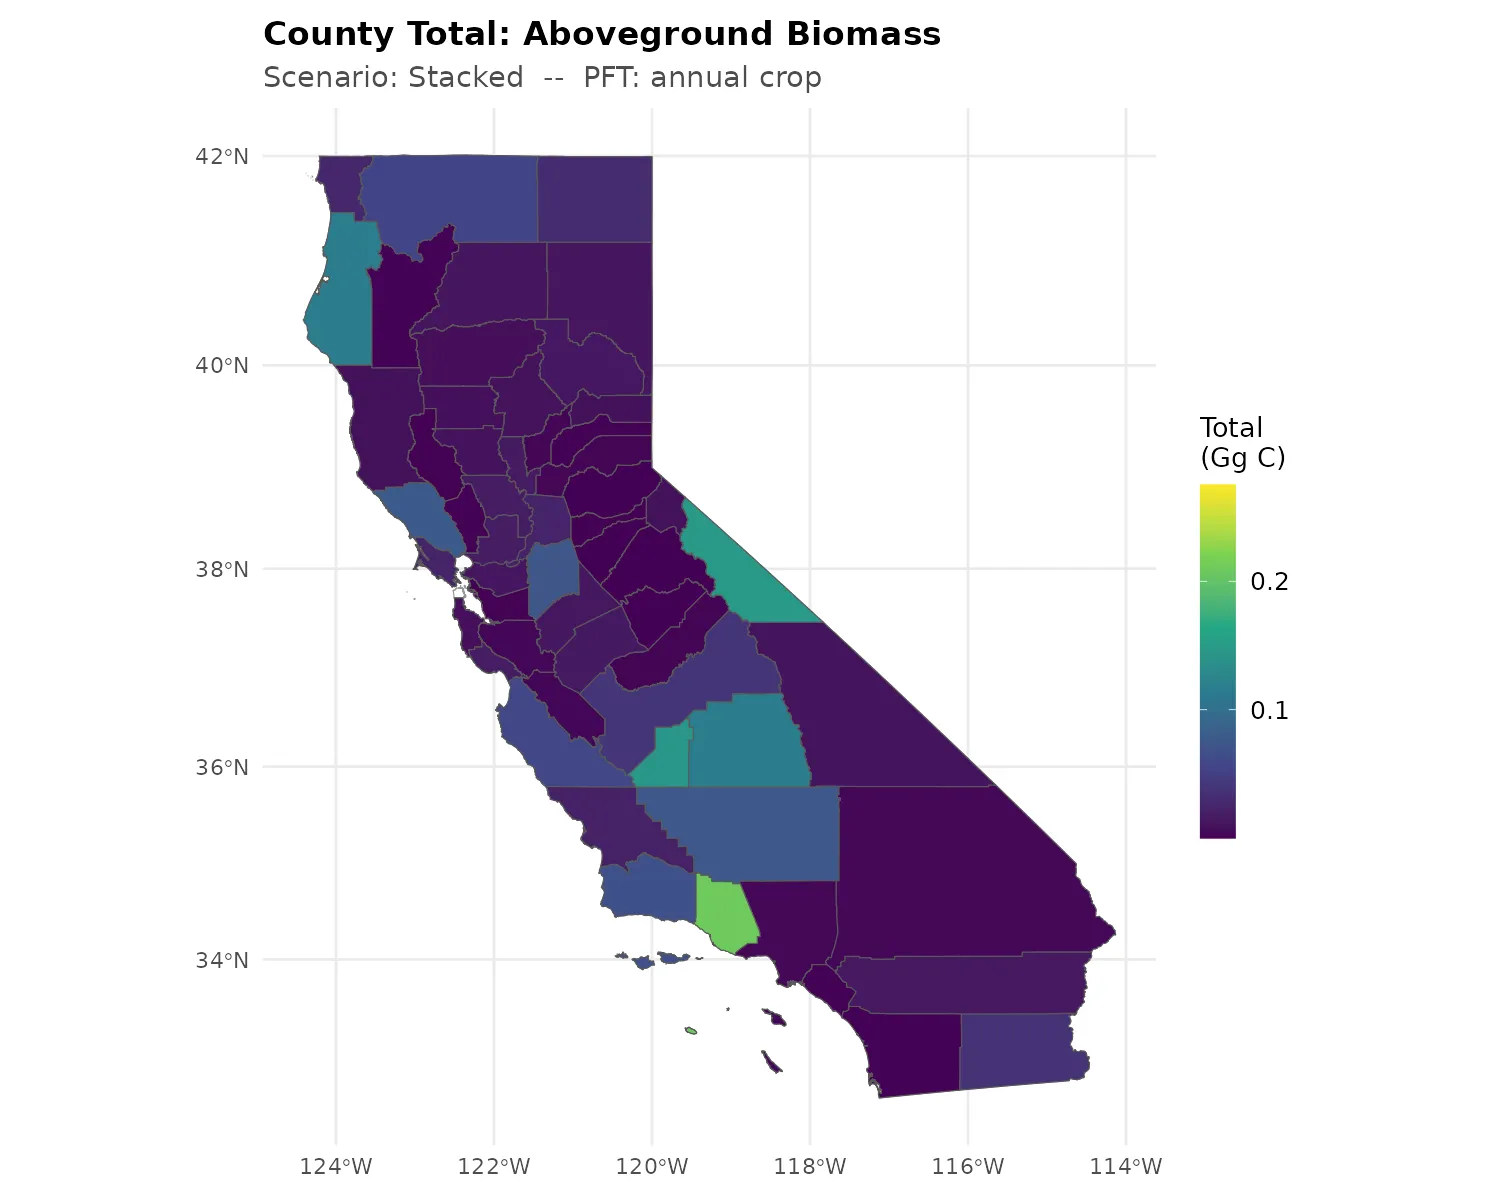
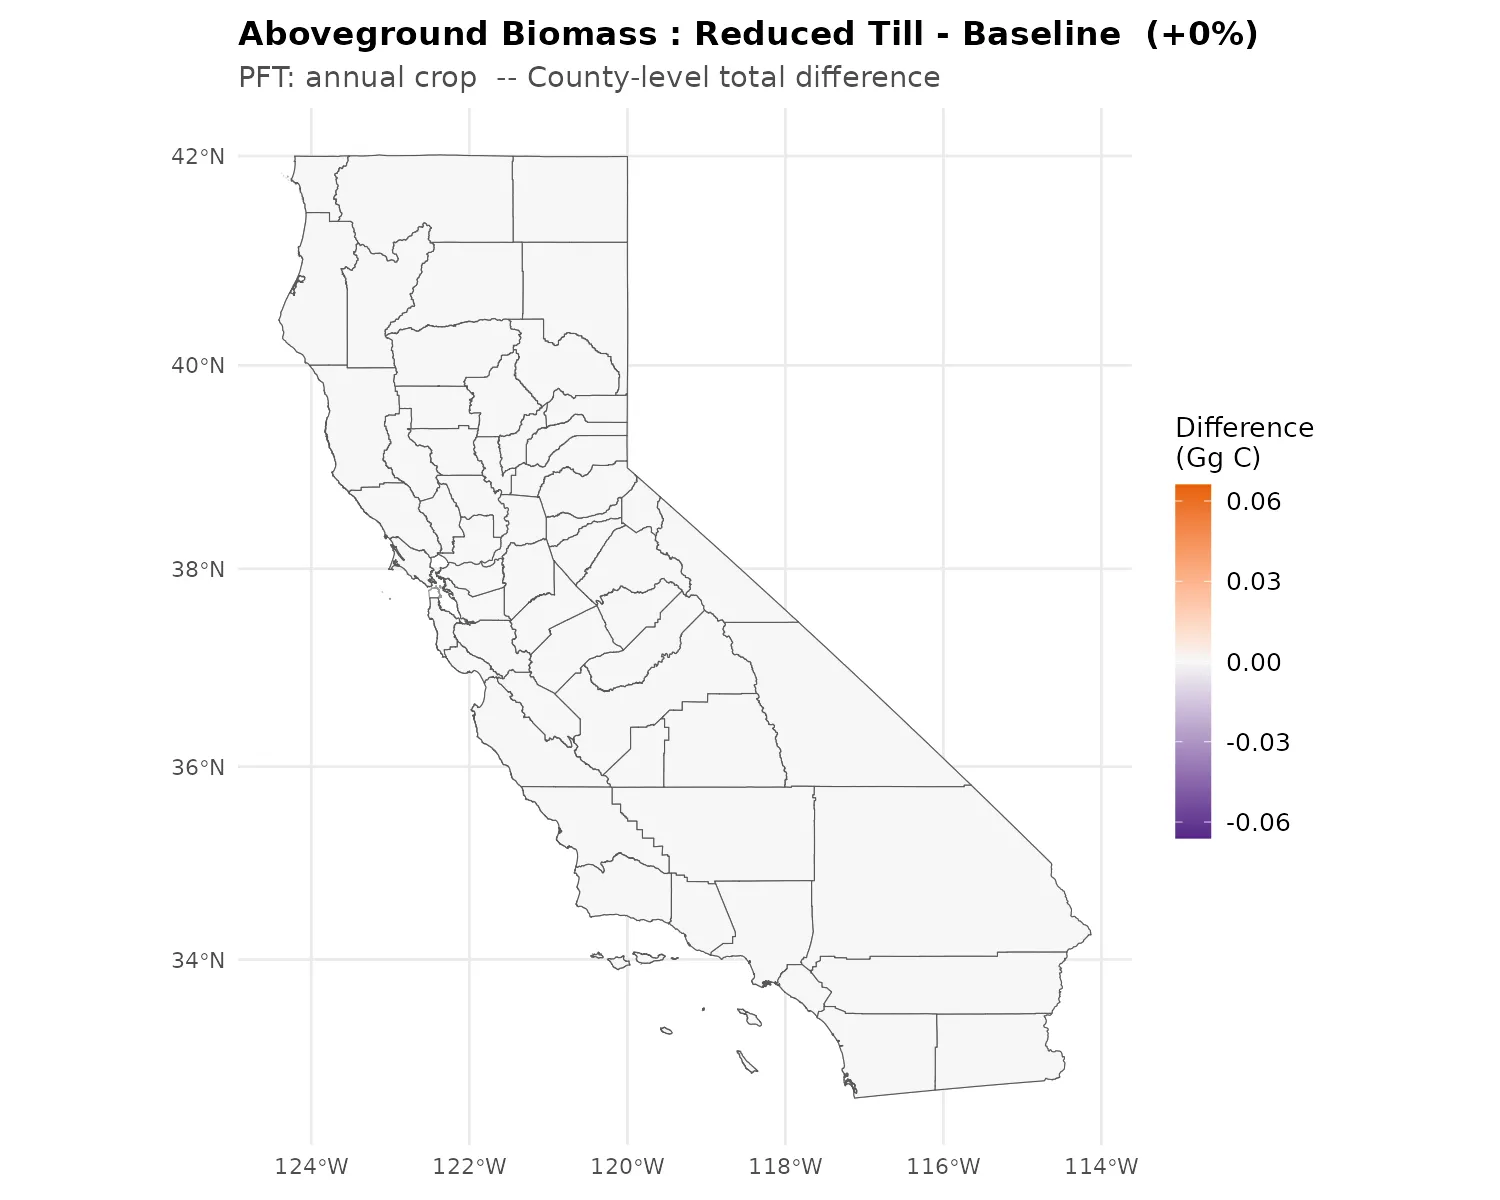
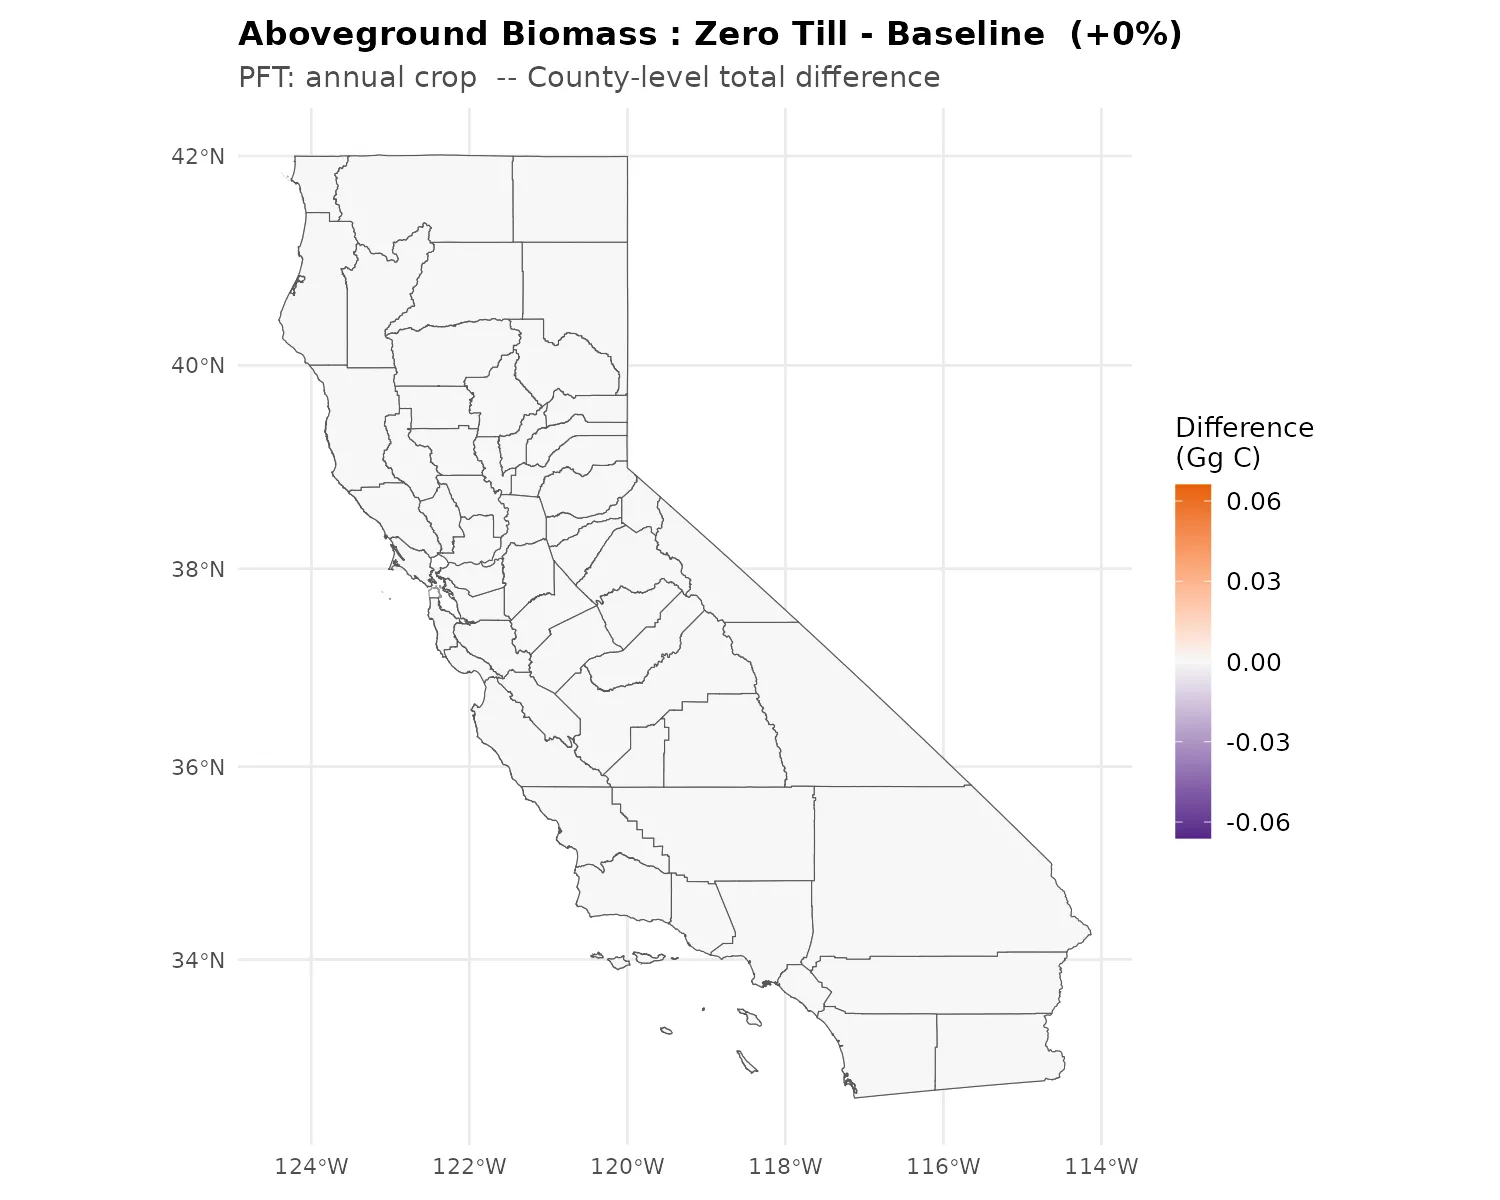
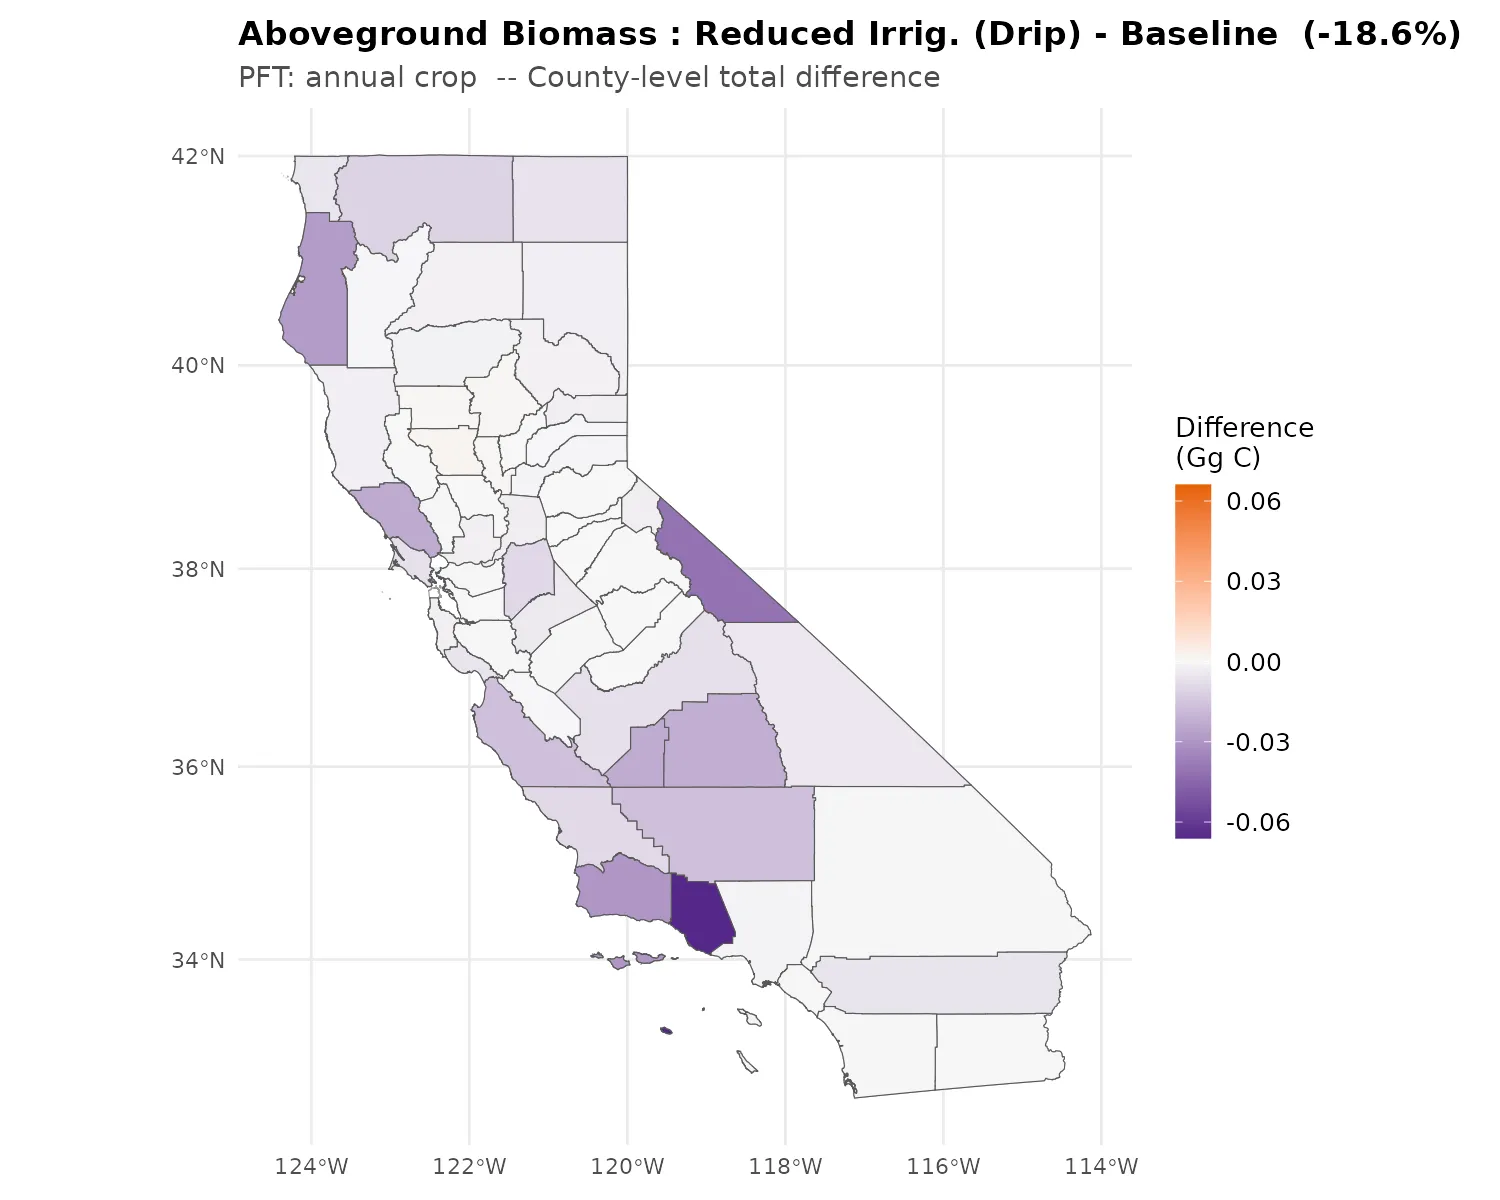
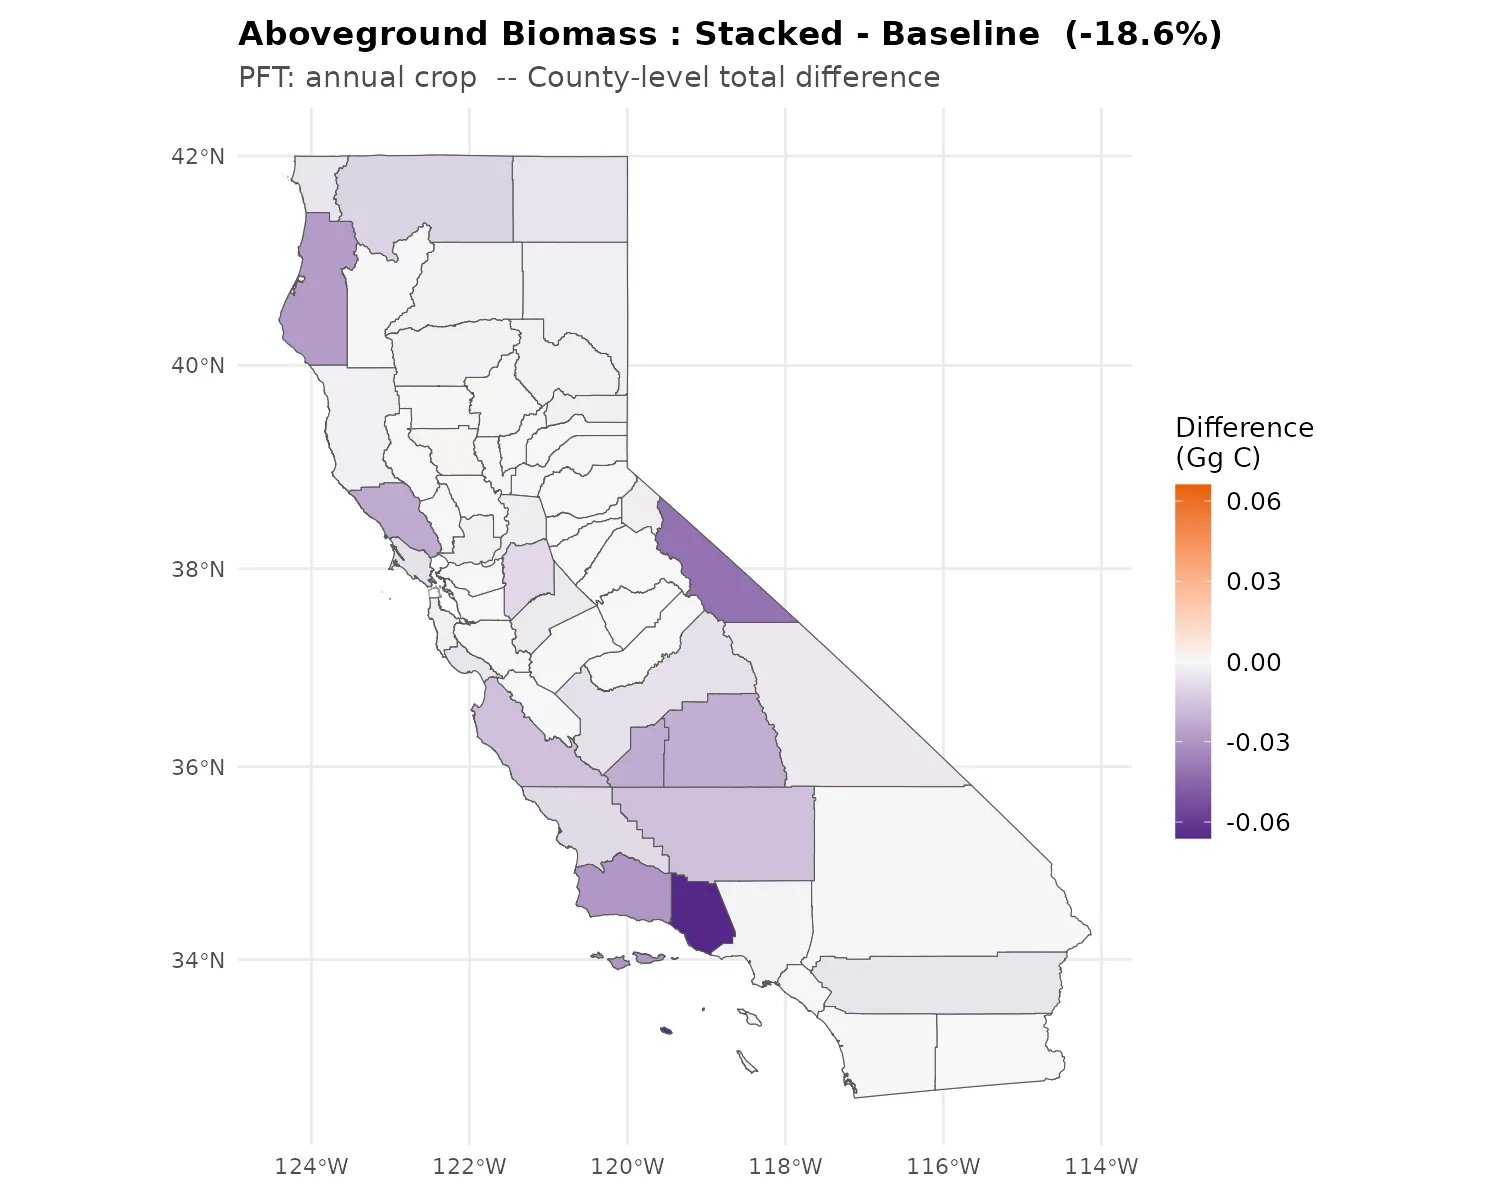
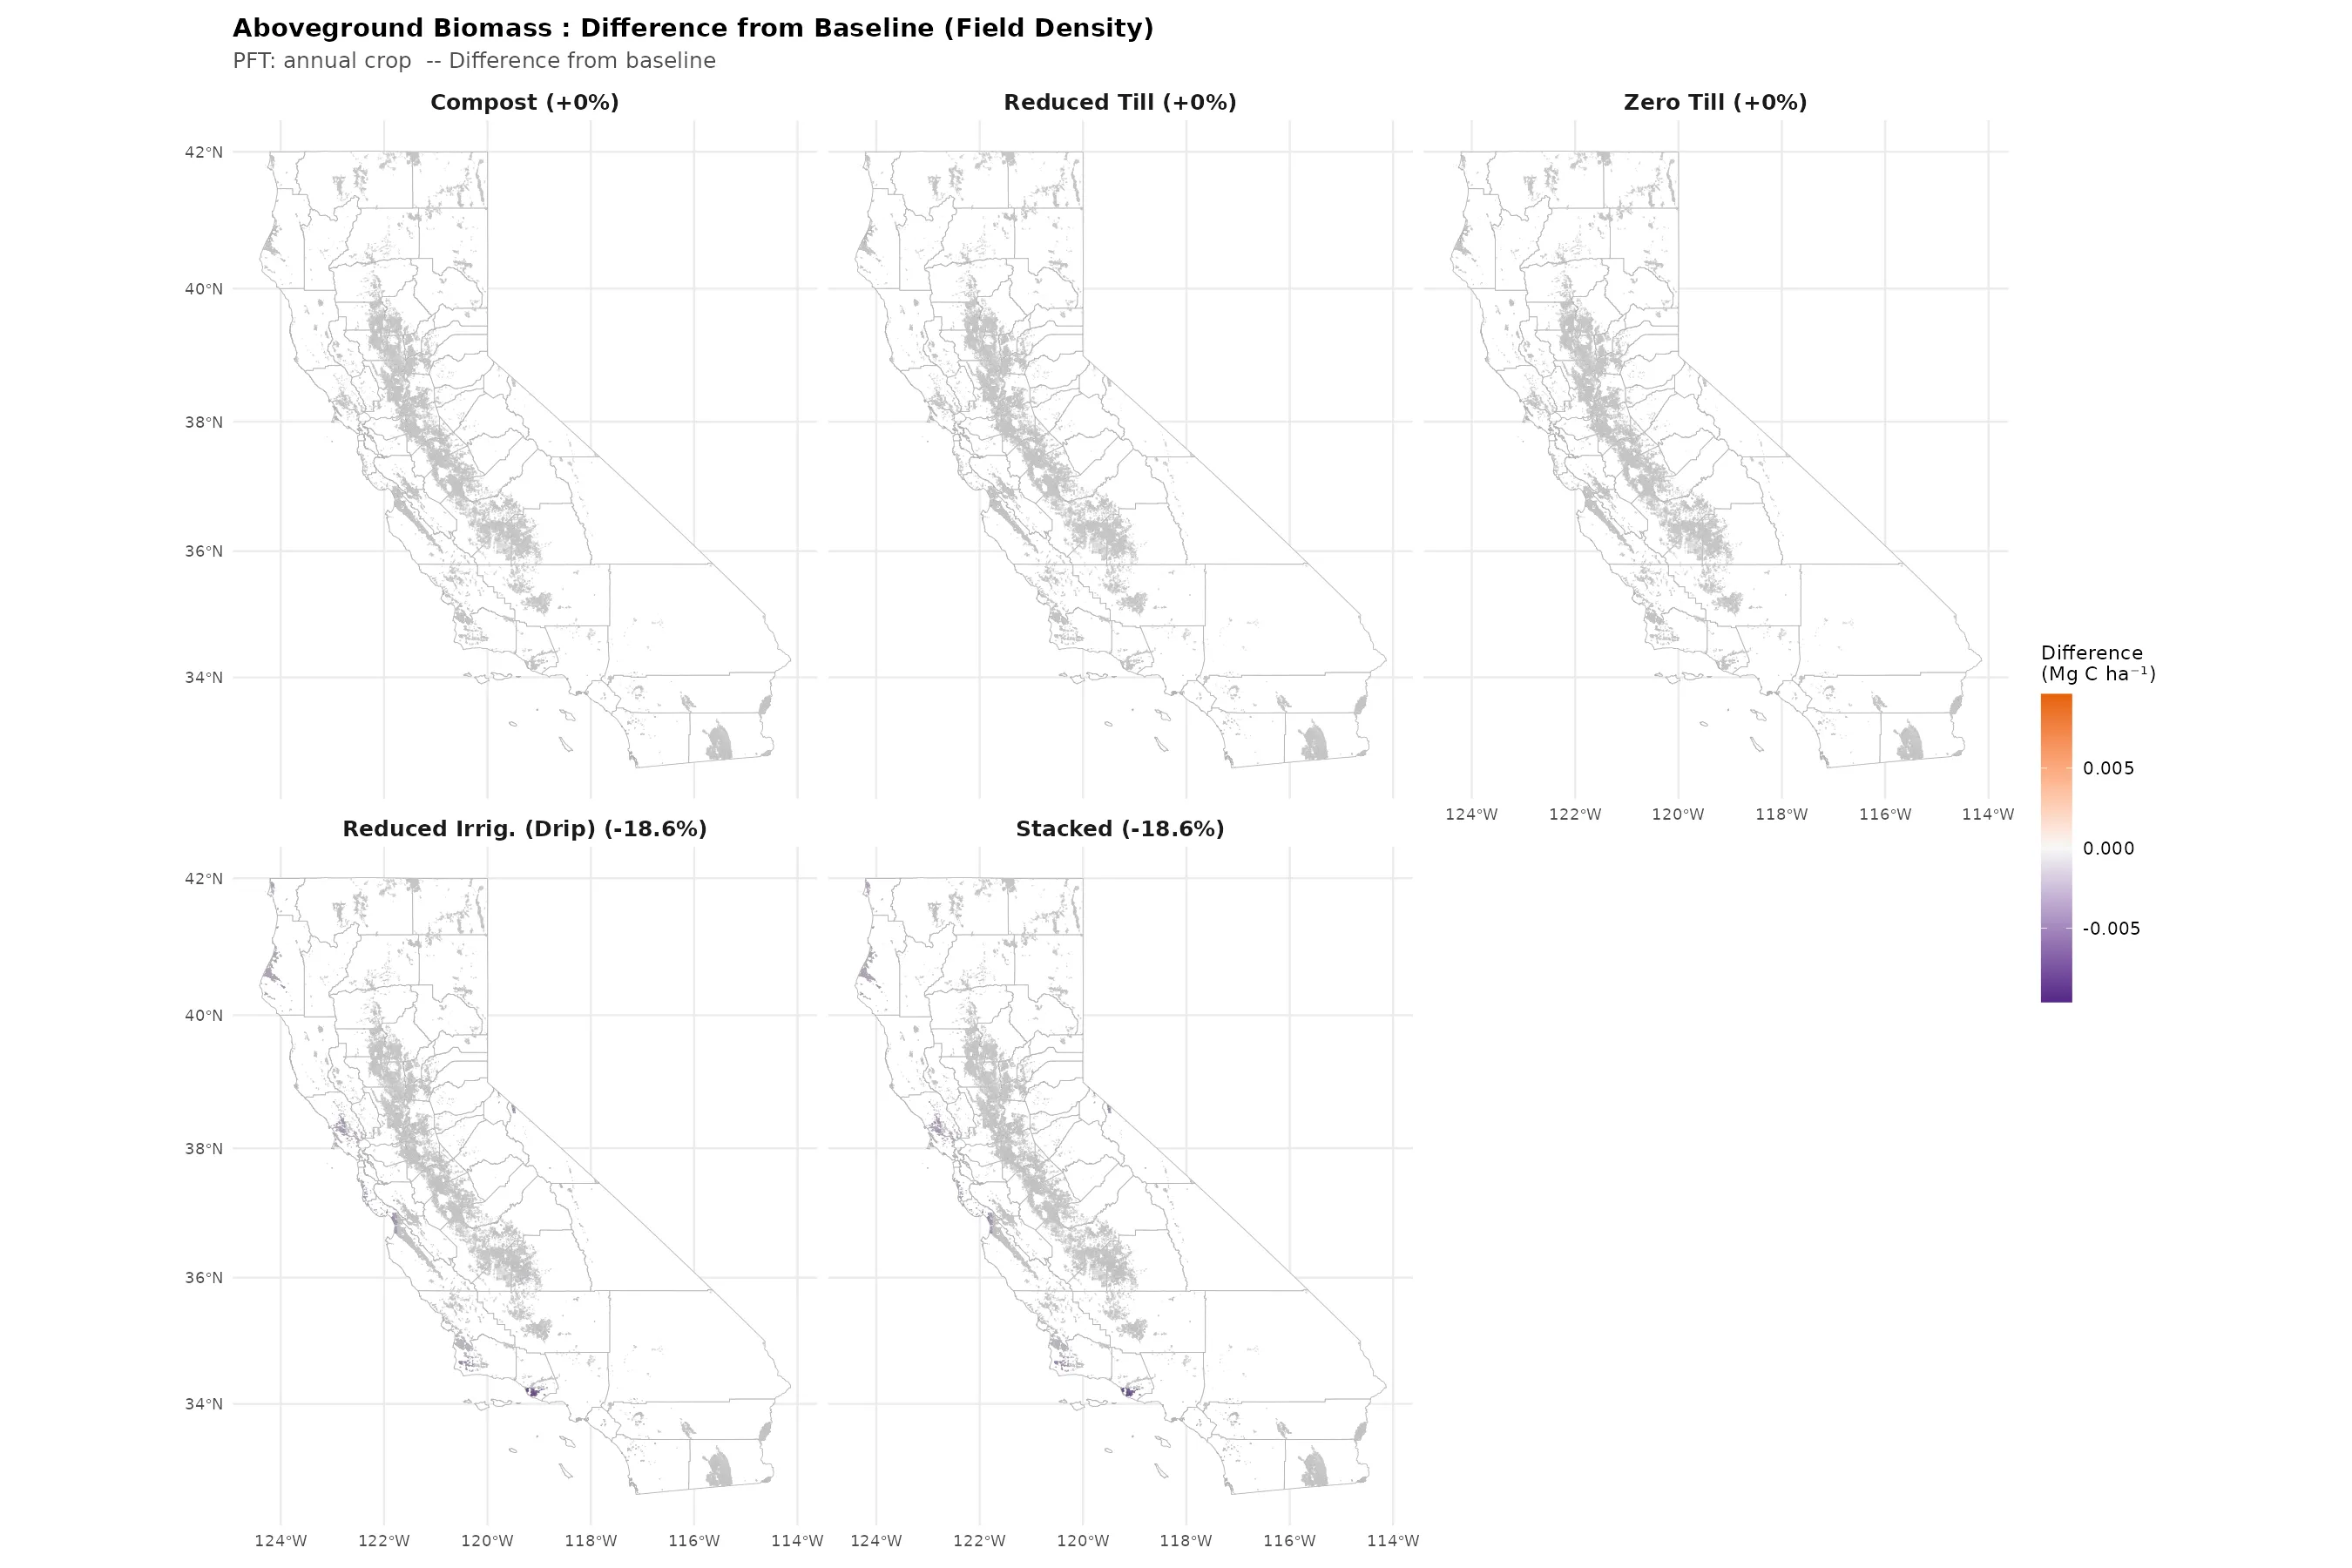
AGB in annual croplands reflects biomass remaining after harvest. Statewide totals are very small (~40 Mg total across all fields) compared to soil carbon pools (~112 Tg C). For tillage and compost scenarios, AGB differences from baseline are effectively zero (0.0%), confirming that these management practices do not alter crop standing biomass in SIPNET. Drip irrigation and stacked scenarios show a -18.6% AGB reduction, reflecting altered water availability affecting end-of-season residue. AGB is most useful as an indicator of crop productivity differences and residue availability for soil carbon cycling.

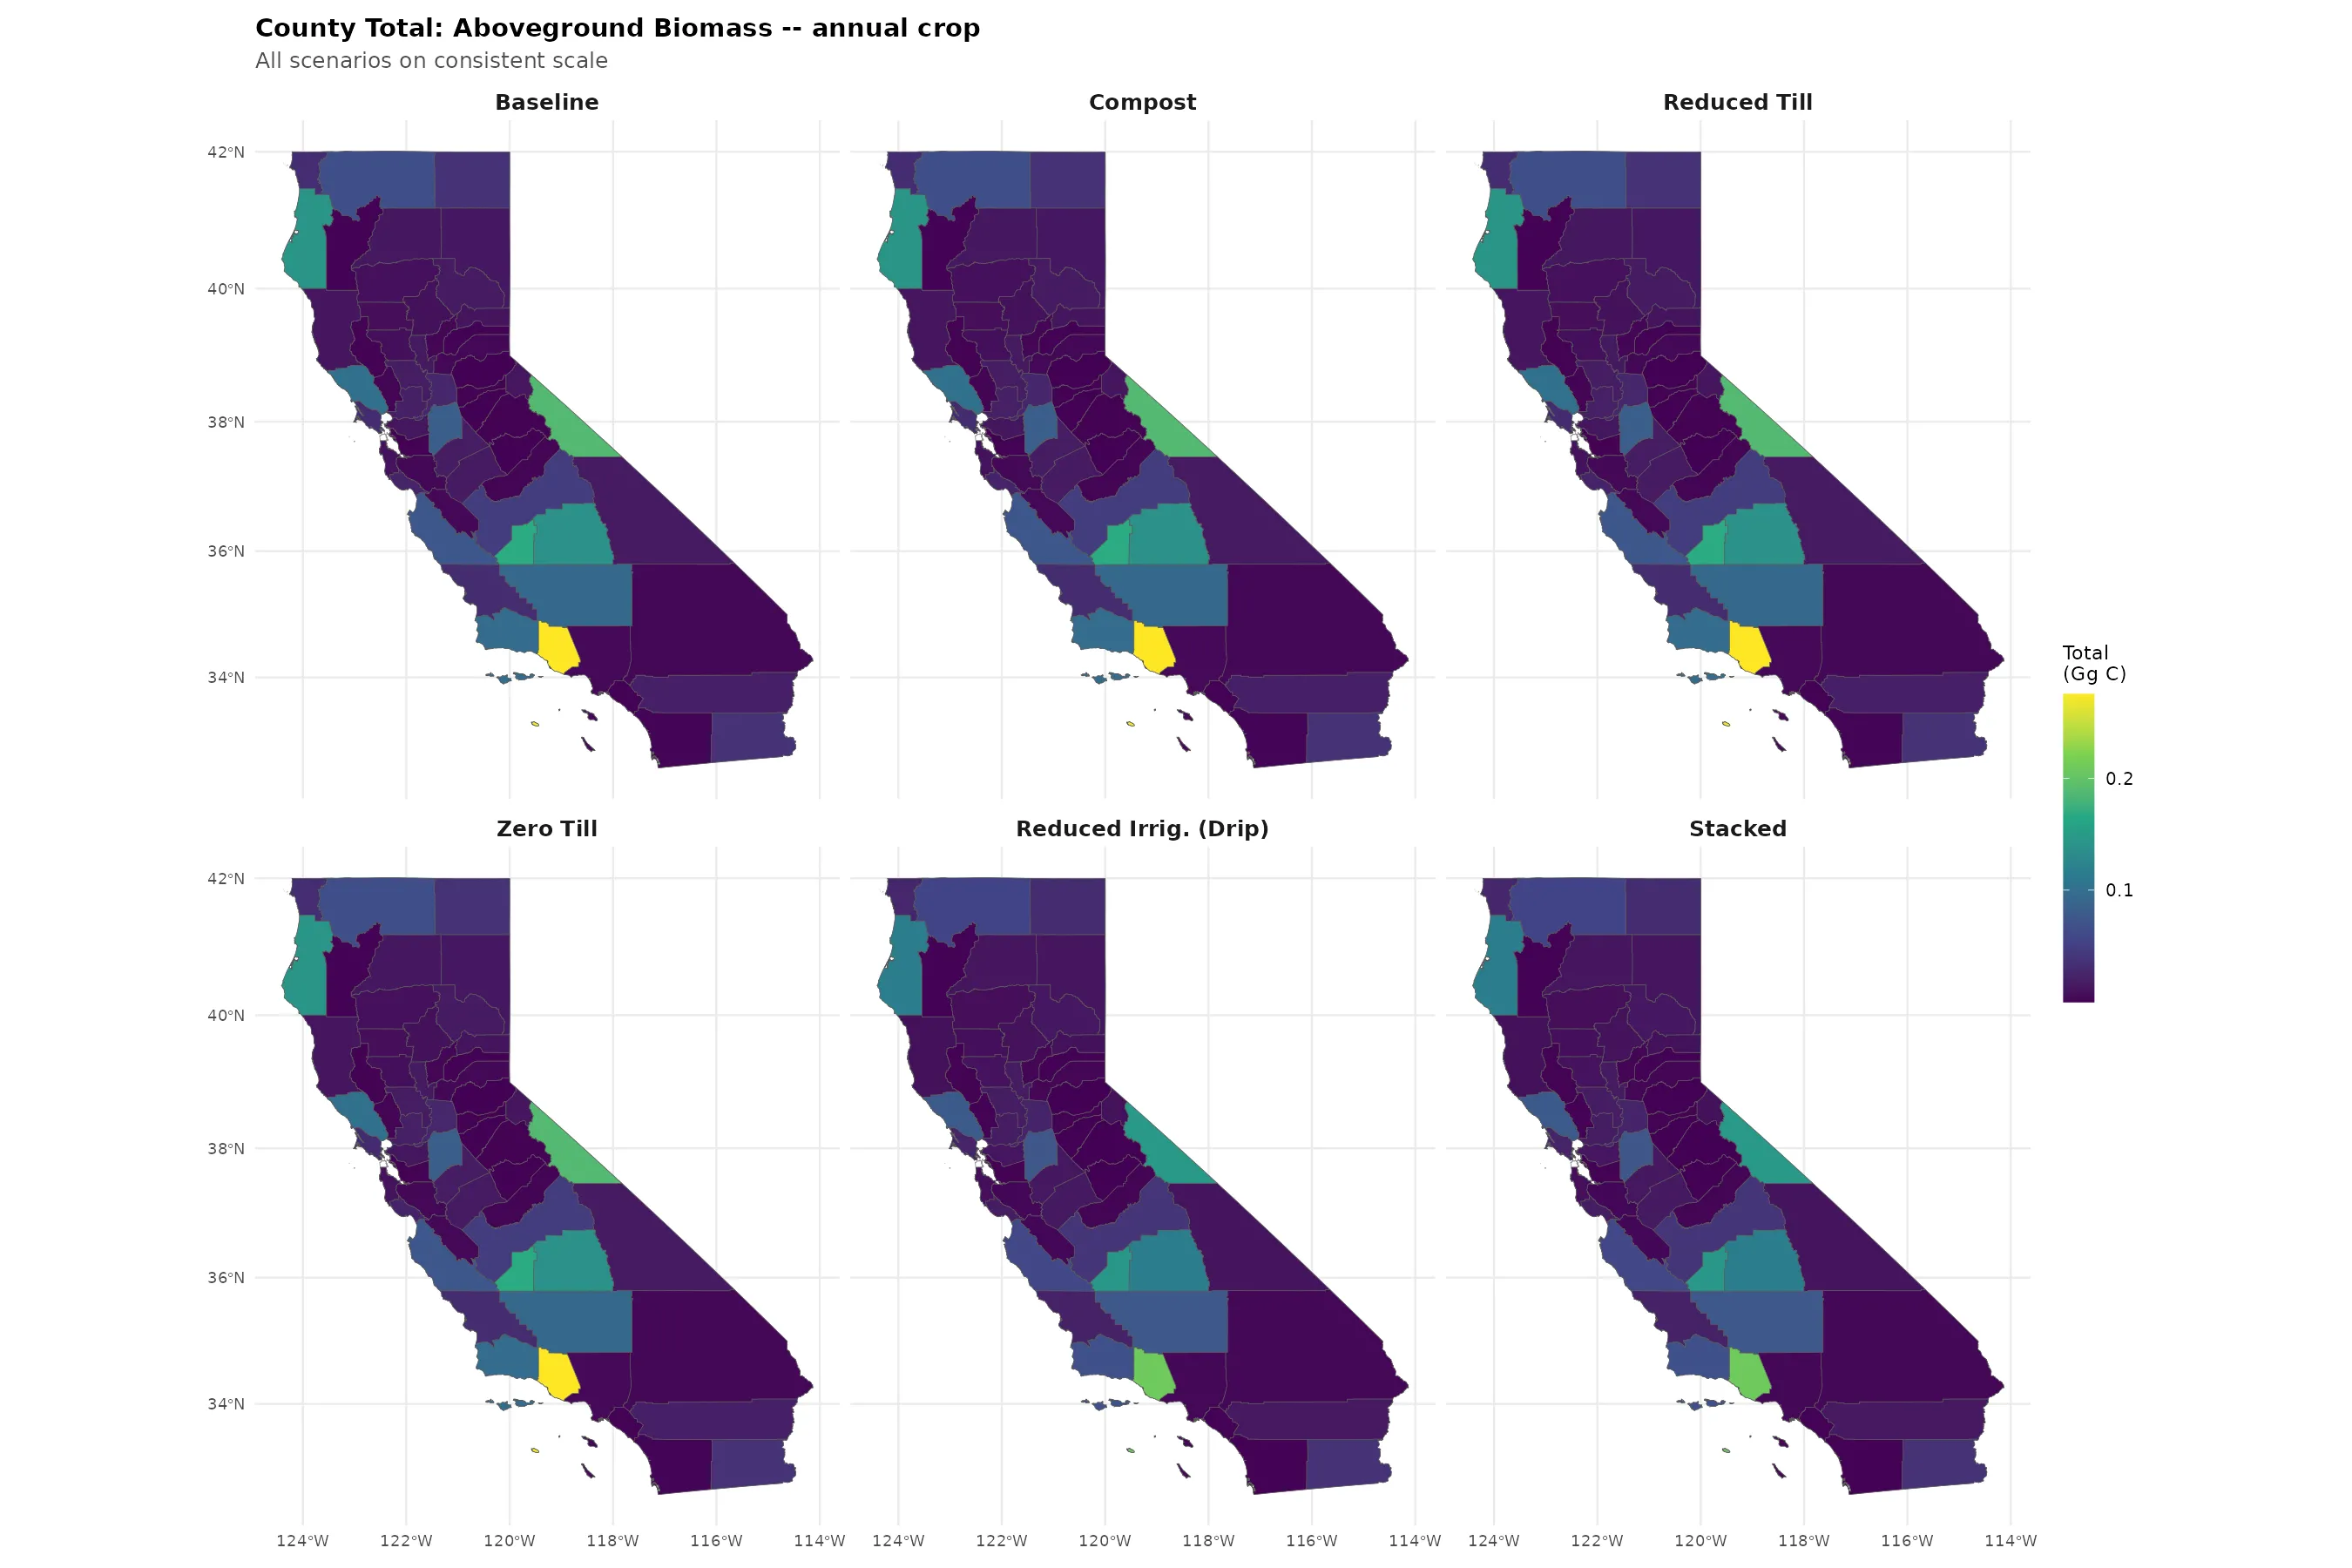
County-Level Aboveground Biomass

Mixed Comparison: Baseline + Scenario Differences

Mixed comparison showing baseline AGB alongside scenario differences

Baseline absolute + scenario differences for AGB

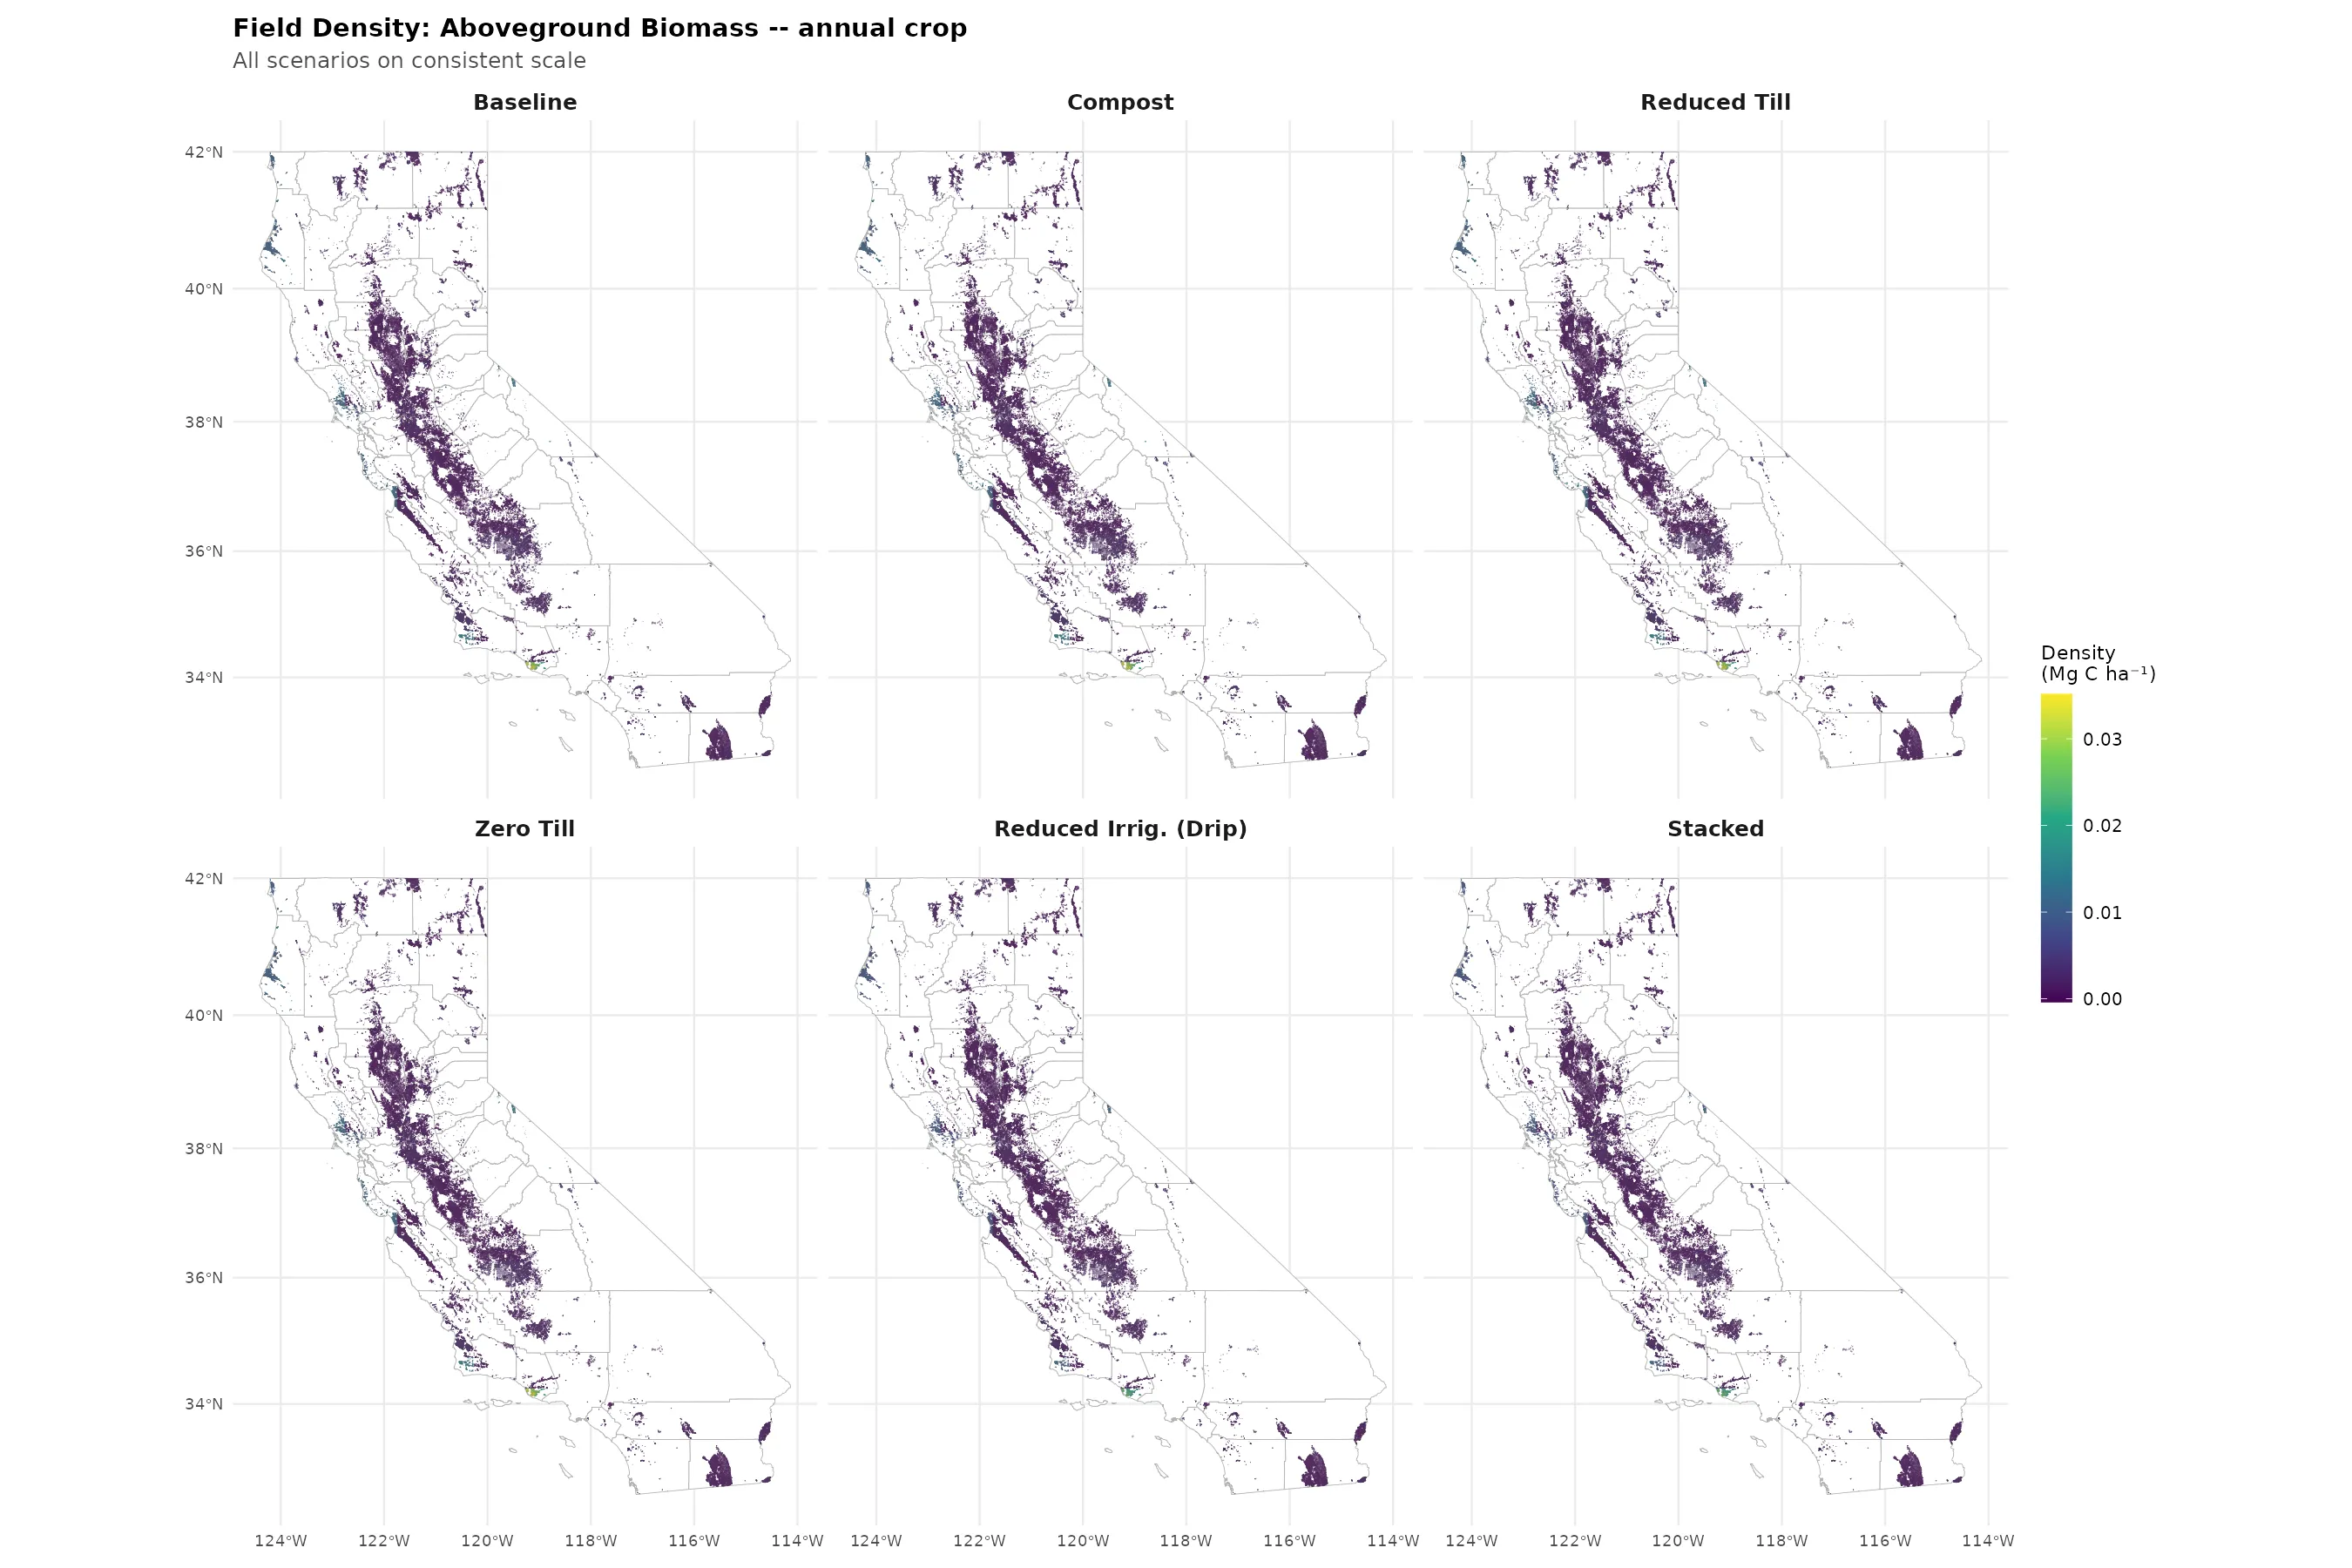
All Scenarios Side-by-Side

Faceted county-level AGB maps for all scenarios

Faceted county AGB – all scenarios

Faceted county-level AGB difference maps

Faceted county AGB differences

Individual AGB Scenarios

Baseline county total AGB map

County AGB – Baseline

Compost county total AGB map

County AGB – Compost

Reduced till county total AGB map

County AGB – Reduced Till

Zero till county total AGB map

County AGB – Zero Till

Drip irrigation county total AGB map

County AGB – Drip Irrigation

Stacked county total AGB map

County AGB – Stacked

Individual AGB Difference Maps

Compost minus baseline AGB difference map

AGB difference – Compost vs Baseline

Reduced till minus baseline AGB difference map

AGB difference – Reduced Till vs Baseline

Zero till minus baseline AGB difference map

AGB difference – Zero Till vs Baseline

Drip irrigation minus baseline AGB difference map

AGB difference – Drip Irrig. vs Baseline

Stacked minus baseline AGB difference map

AGB difference – Stacked vs Baseline


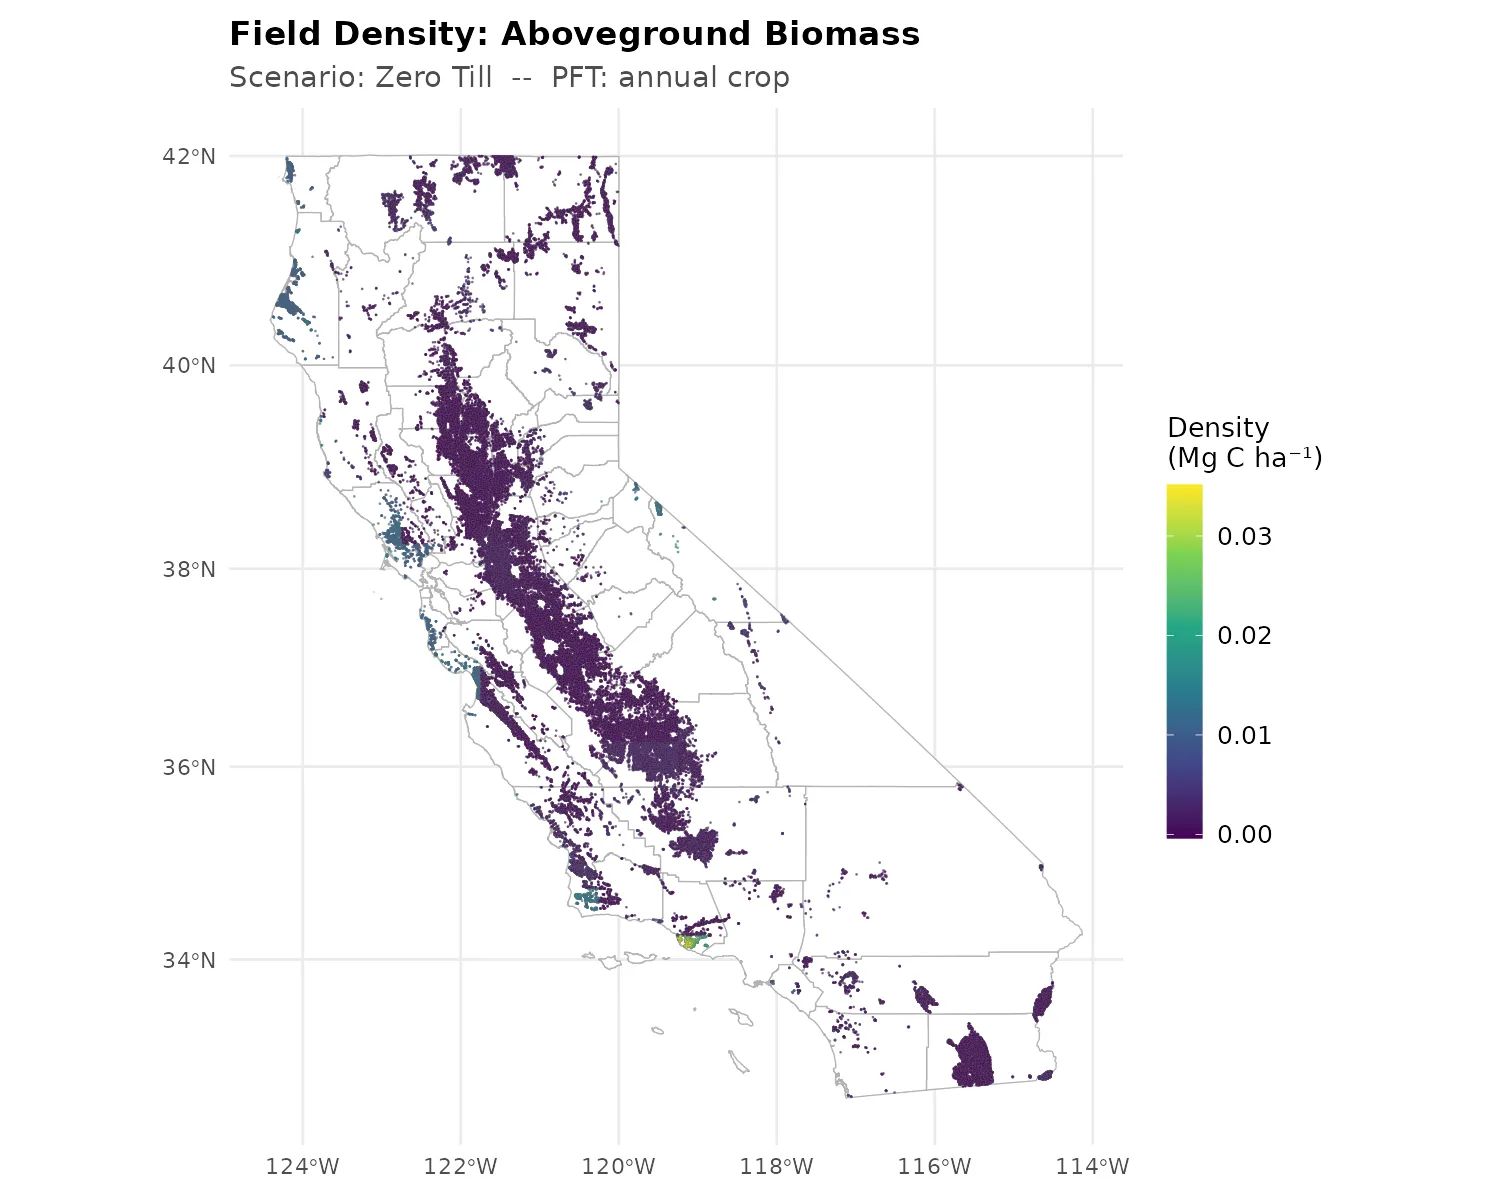
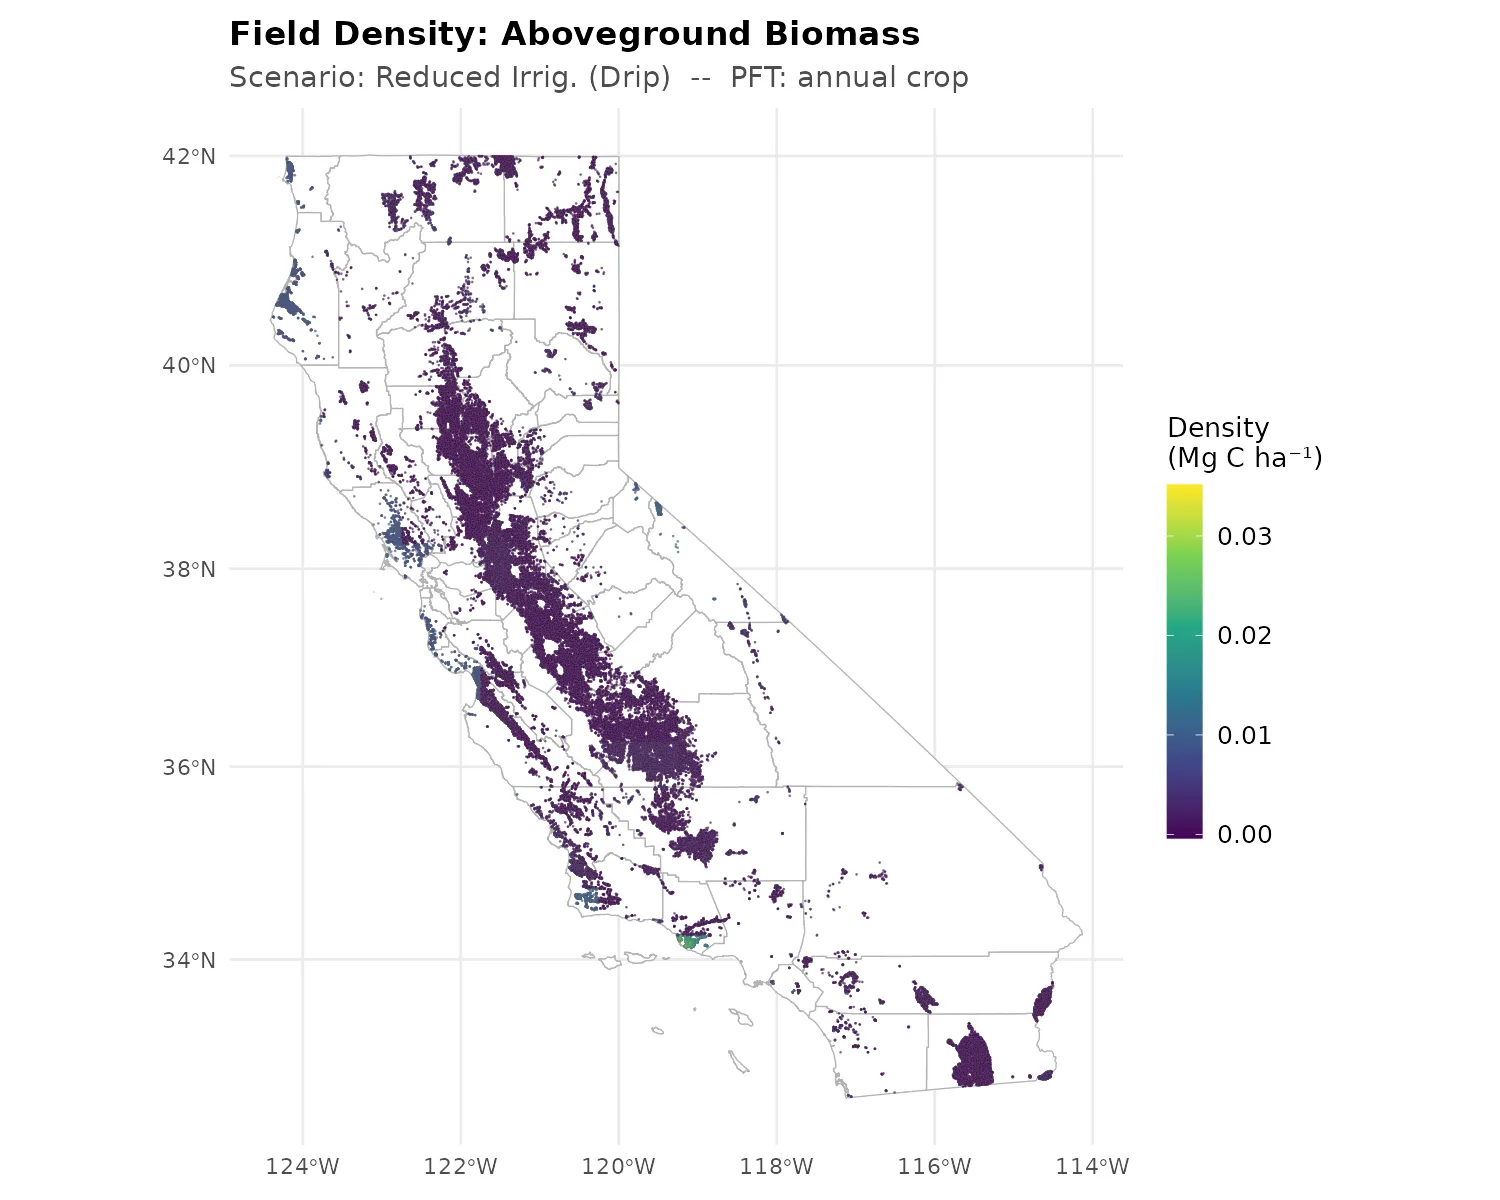
Field-Level AGB Density

All Scenarios

Faceted field-level AGB density maps

Faceted field AGB density – all scenarios

Faceted field-level AGB difference maps

Faceted field AGB differences

Individual Field AGB Maps

Baseline field-level AGB density map

Field AGB density – Baseline

Compost field-level AGB density map

Field AGB density – Compost

Reduced till field-level AGB density map

Field AGB density – Reduced Till

Zero till field-level AGB density map

Field AGB density – Zero Till

Drip irrigation field-level AGB density map

Field AGB density – Drip Irrigation

Stacked field-level AGB density map

Field AGB density – Stacked