GHG Emissions Atlas
Nitrous Oxide and Methane Fluxes – Trade-off Analysis
Greenhouse gas trade-offs determine the net climate benefit of conservation practices. A practice that increases soil carbon (good) but also increases N2O or CH4 emissions may have a reduced or even negative net benefit when expressed in CO2 equivalents. See the Scenario Definition Table for practice parameters and simulation details.
These results are from a proof-of-concept modeling framework that has not been validated against field observations. Interpret all values as illustrative projections, not empirical estimates.
For GHG flux maps, the interpretation of differences is reversed from soil carbon: increases in emissions represent a climate cost, while decreases represent a climate benefit.
Nitrous Oxide (N2O) Emissions
N2O is a potent greenhouse gas (~298x CO2 over 100 years, GWP100 AR4; IPCC 2007). It is produced by soil microbes during nitrification and denitrification processes. Tillage, nitrogen inputs (e.g. compost), and water management all influence N2O production.
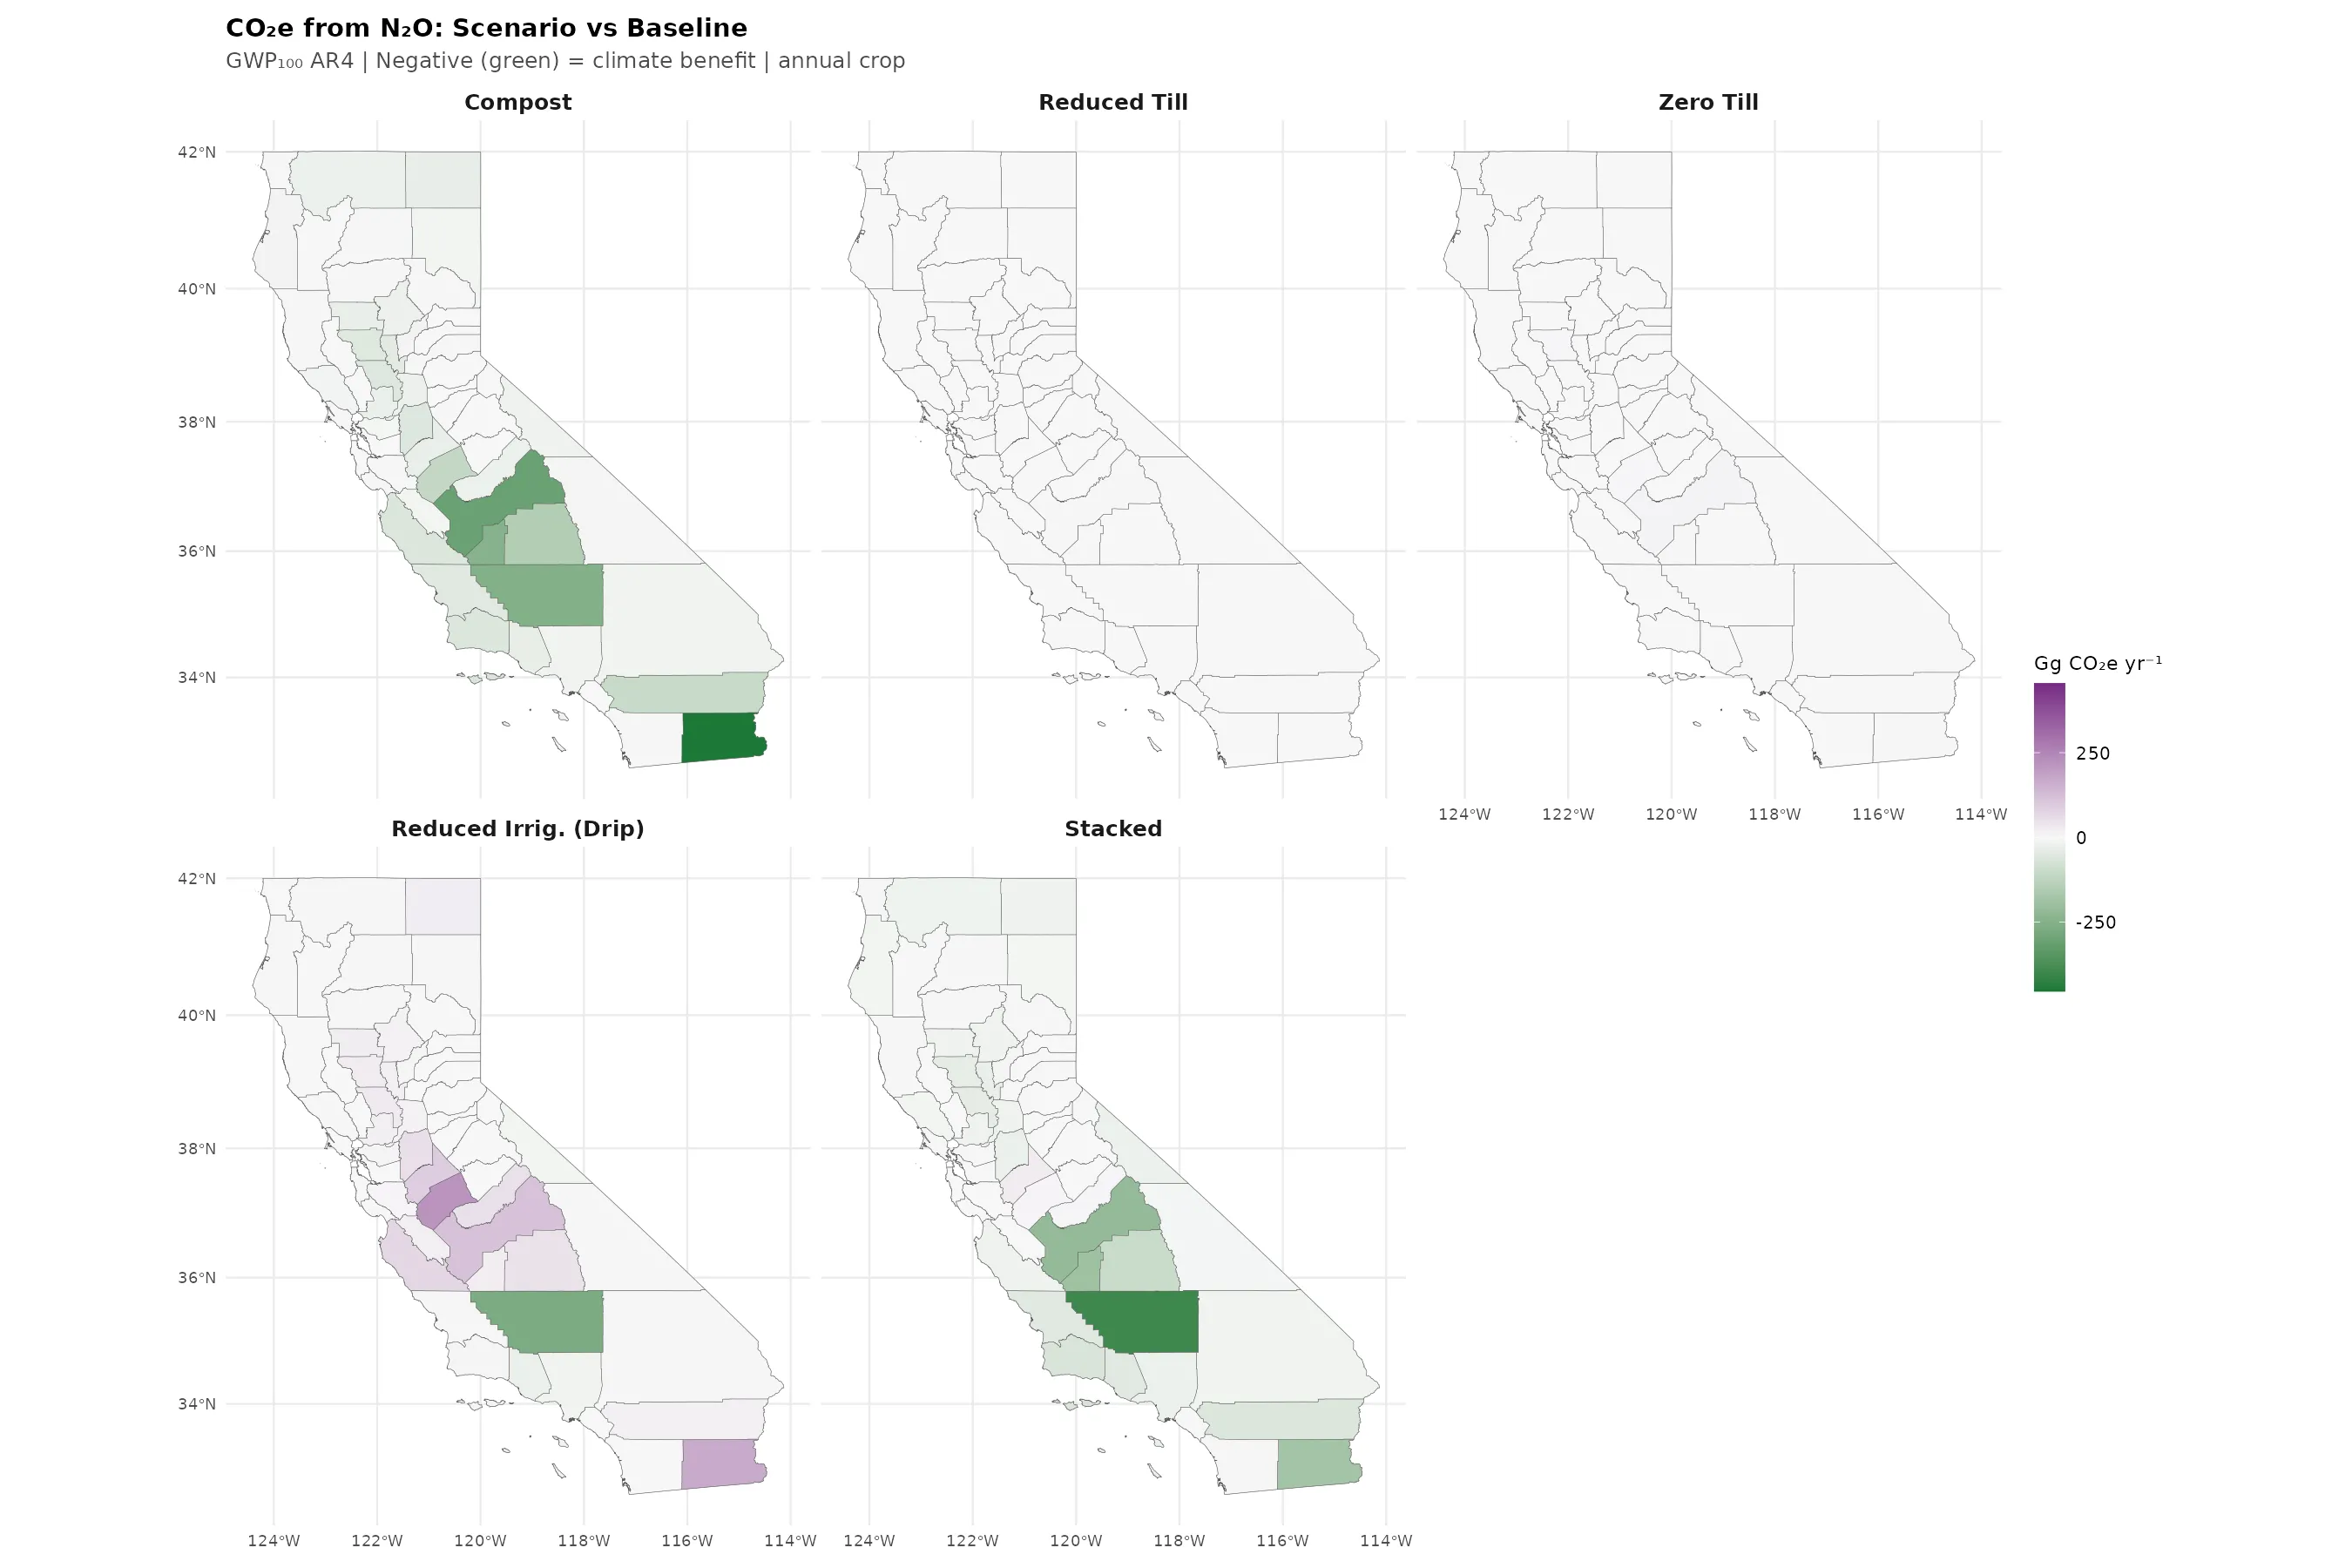
Combined View: Baseline + Scenario Differences
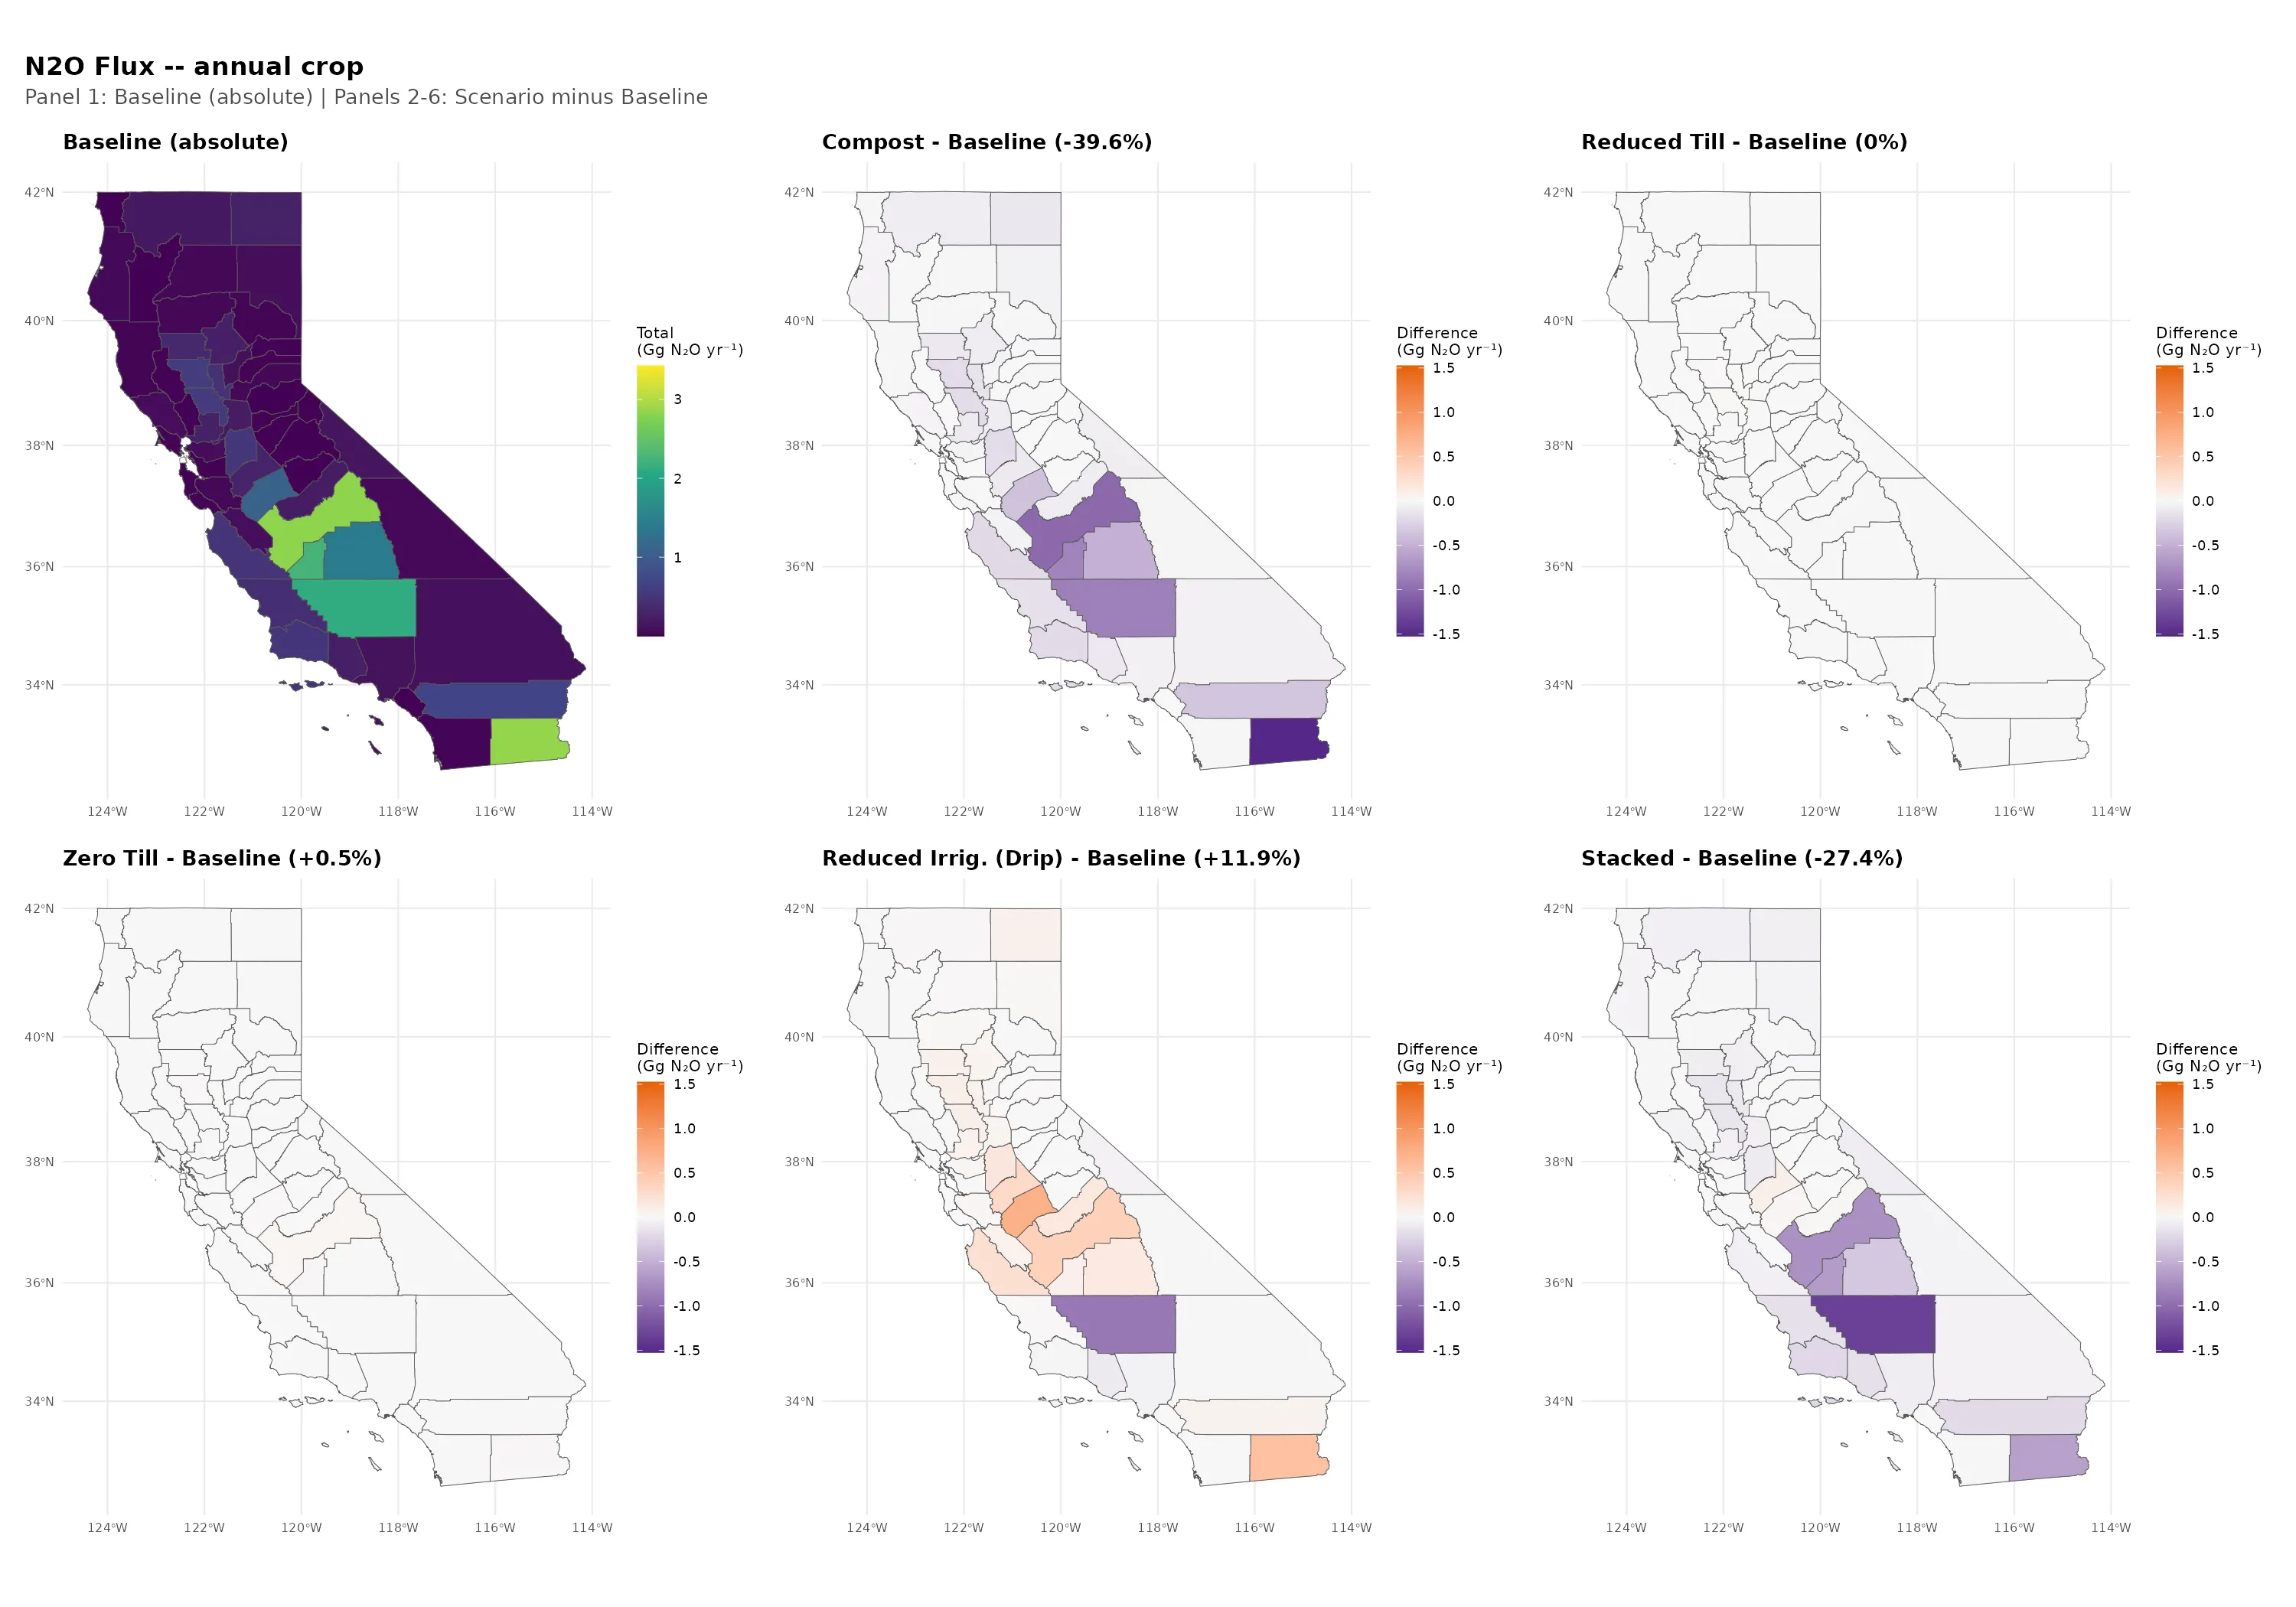
Compost and stacked scenarios show the largest N2O reductions (-39.5% and -27.3% statewide, respectively). Drip irrigation (+12.0%) increases N2O emissions. Reduced till (+0.1%) and zero till (+0.5%) show essentially no change in N2O, consistent with van Kessel et al. (2013) who found no-till N2O effects are near zero in dry climates during the first decade.
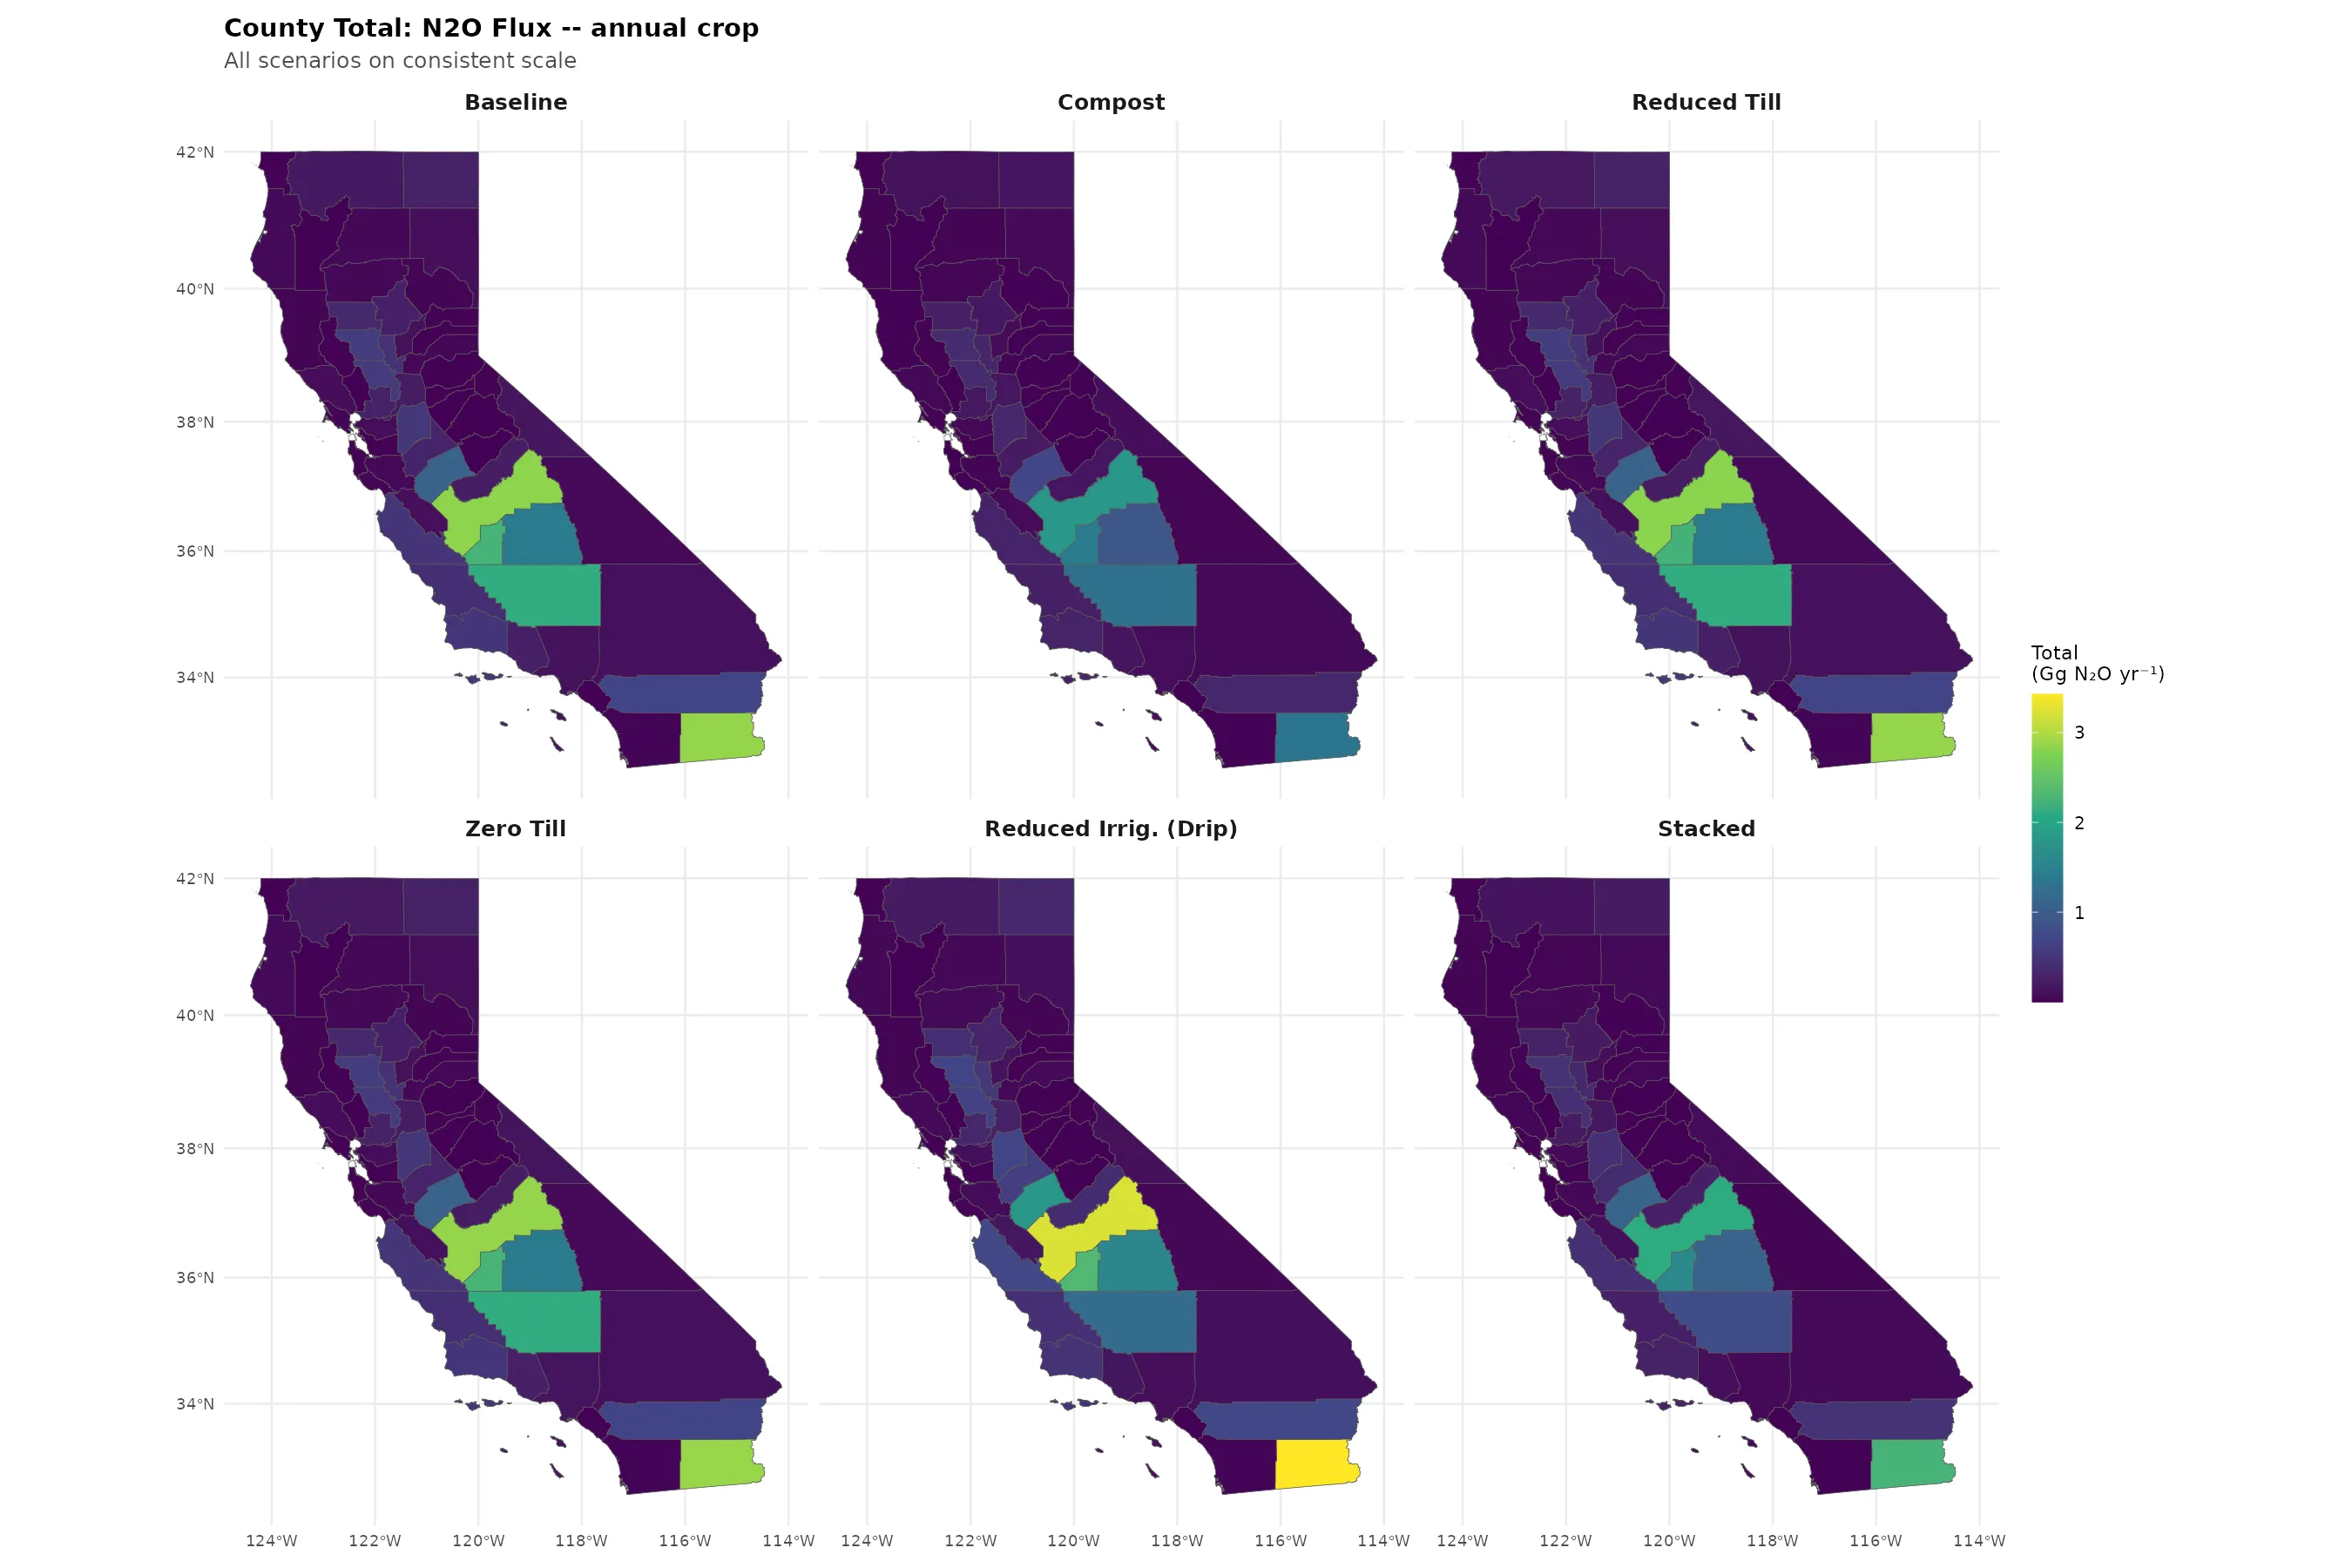
County-Level N2O: All Scenarios
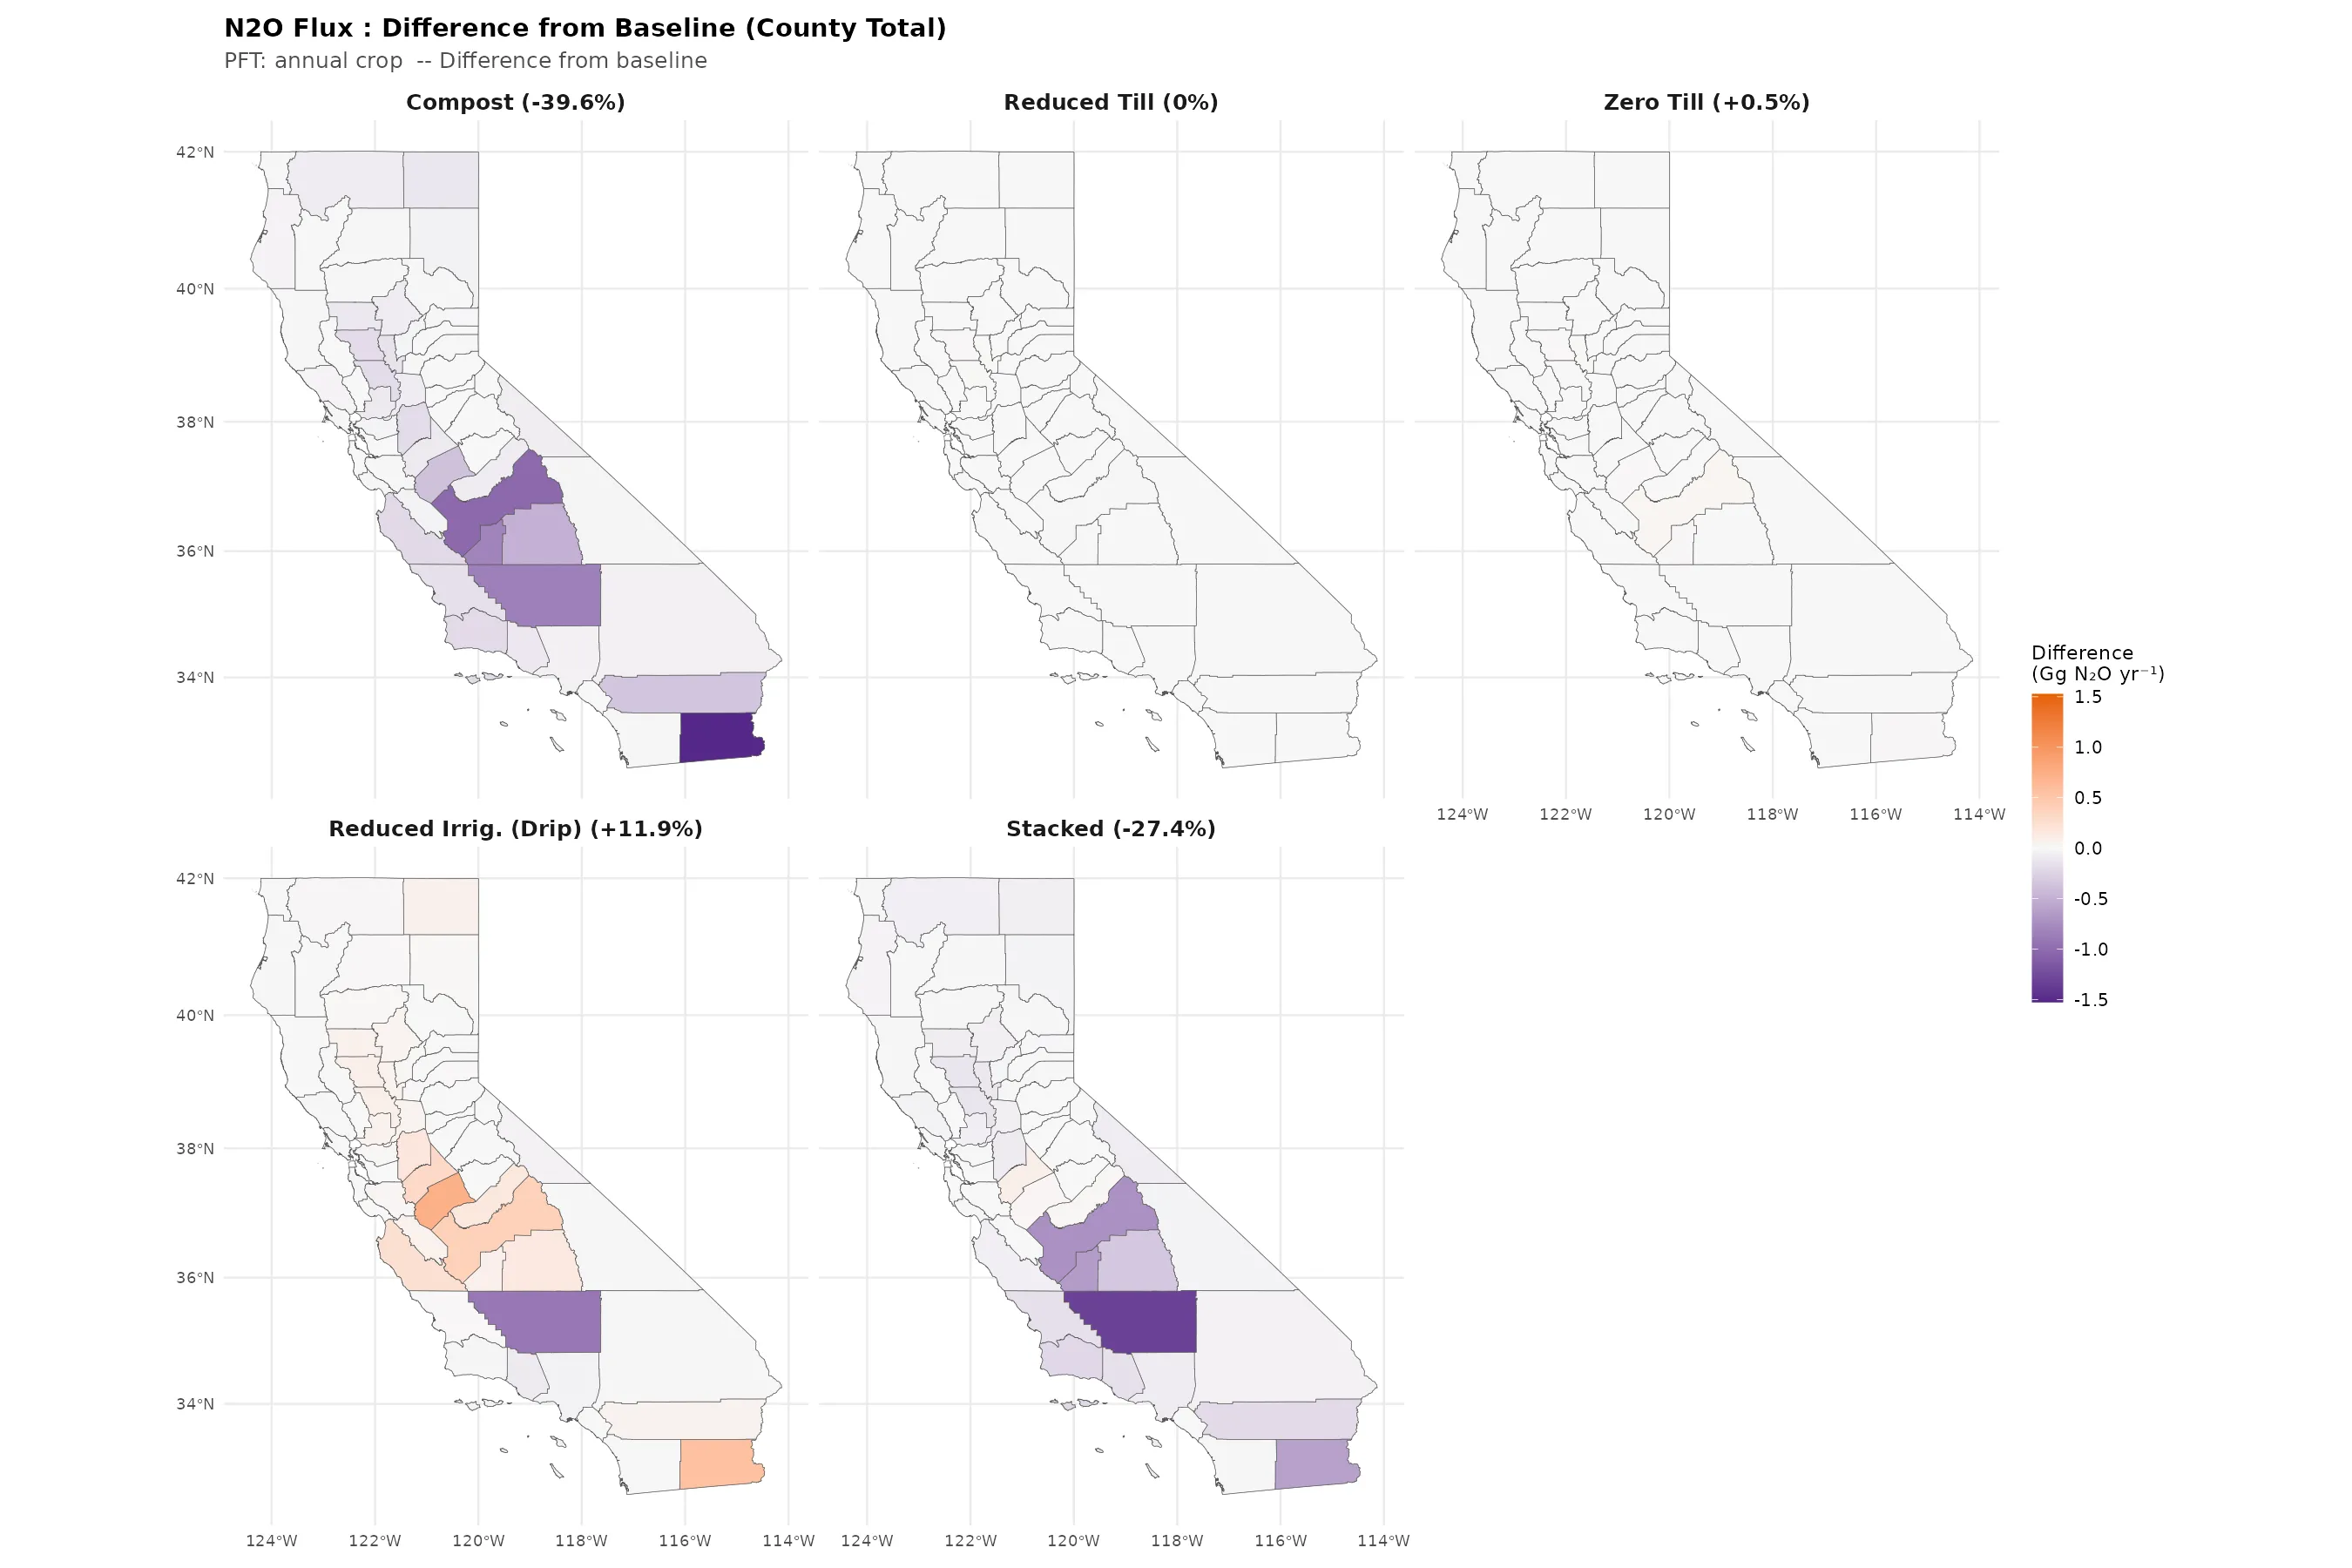
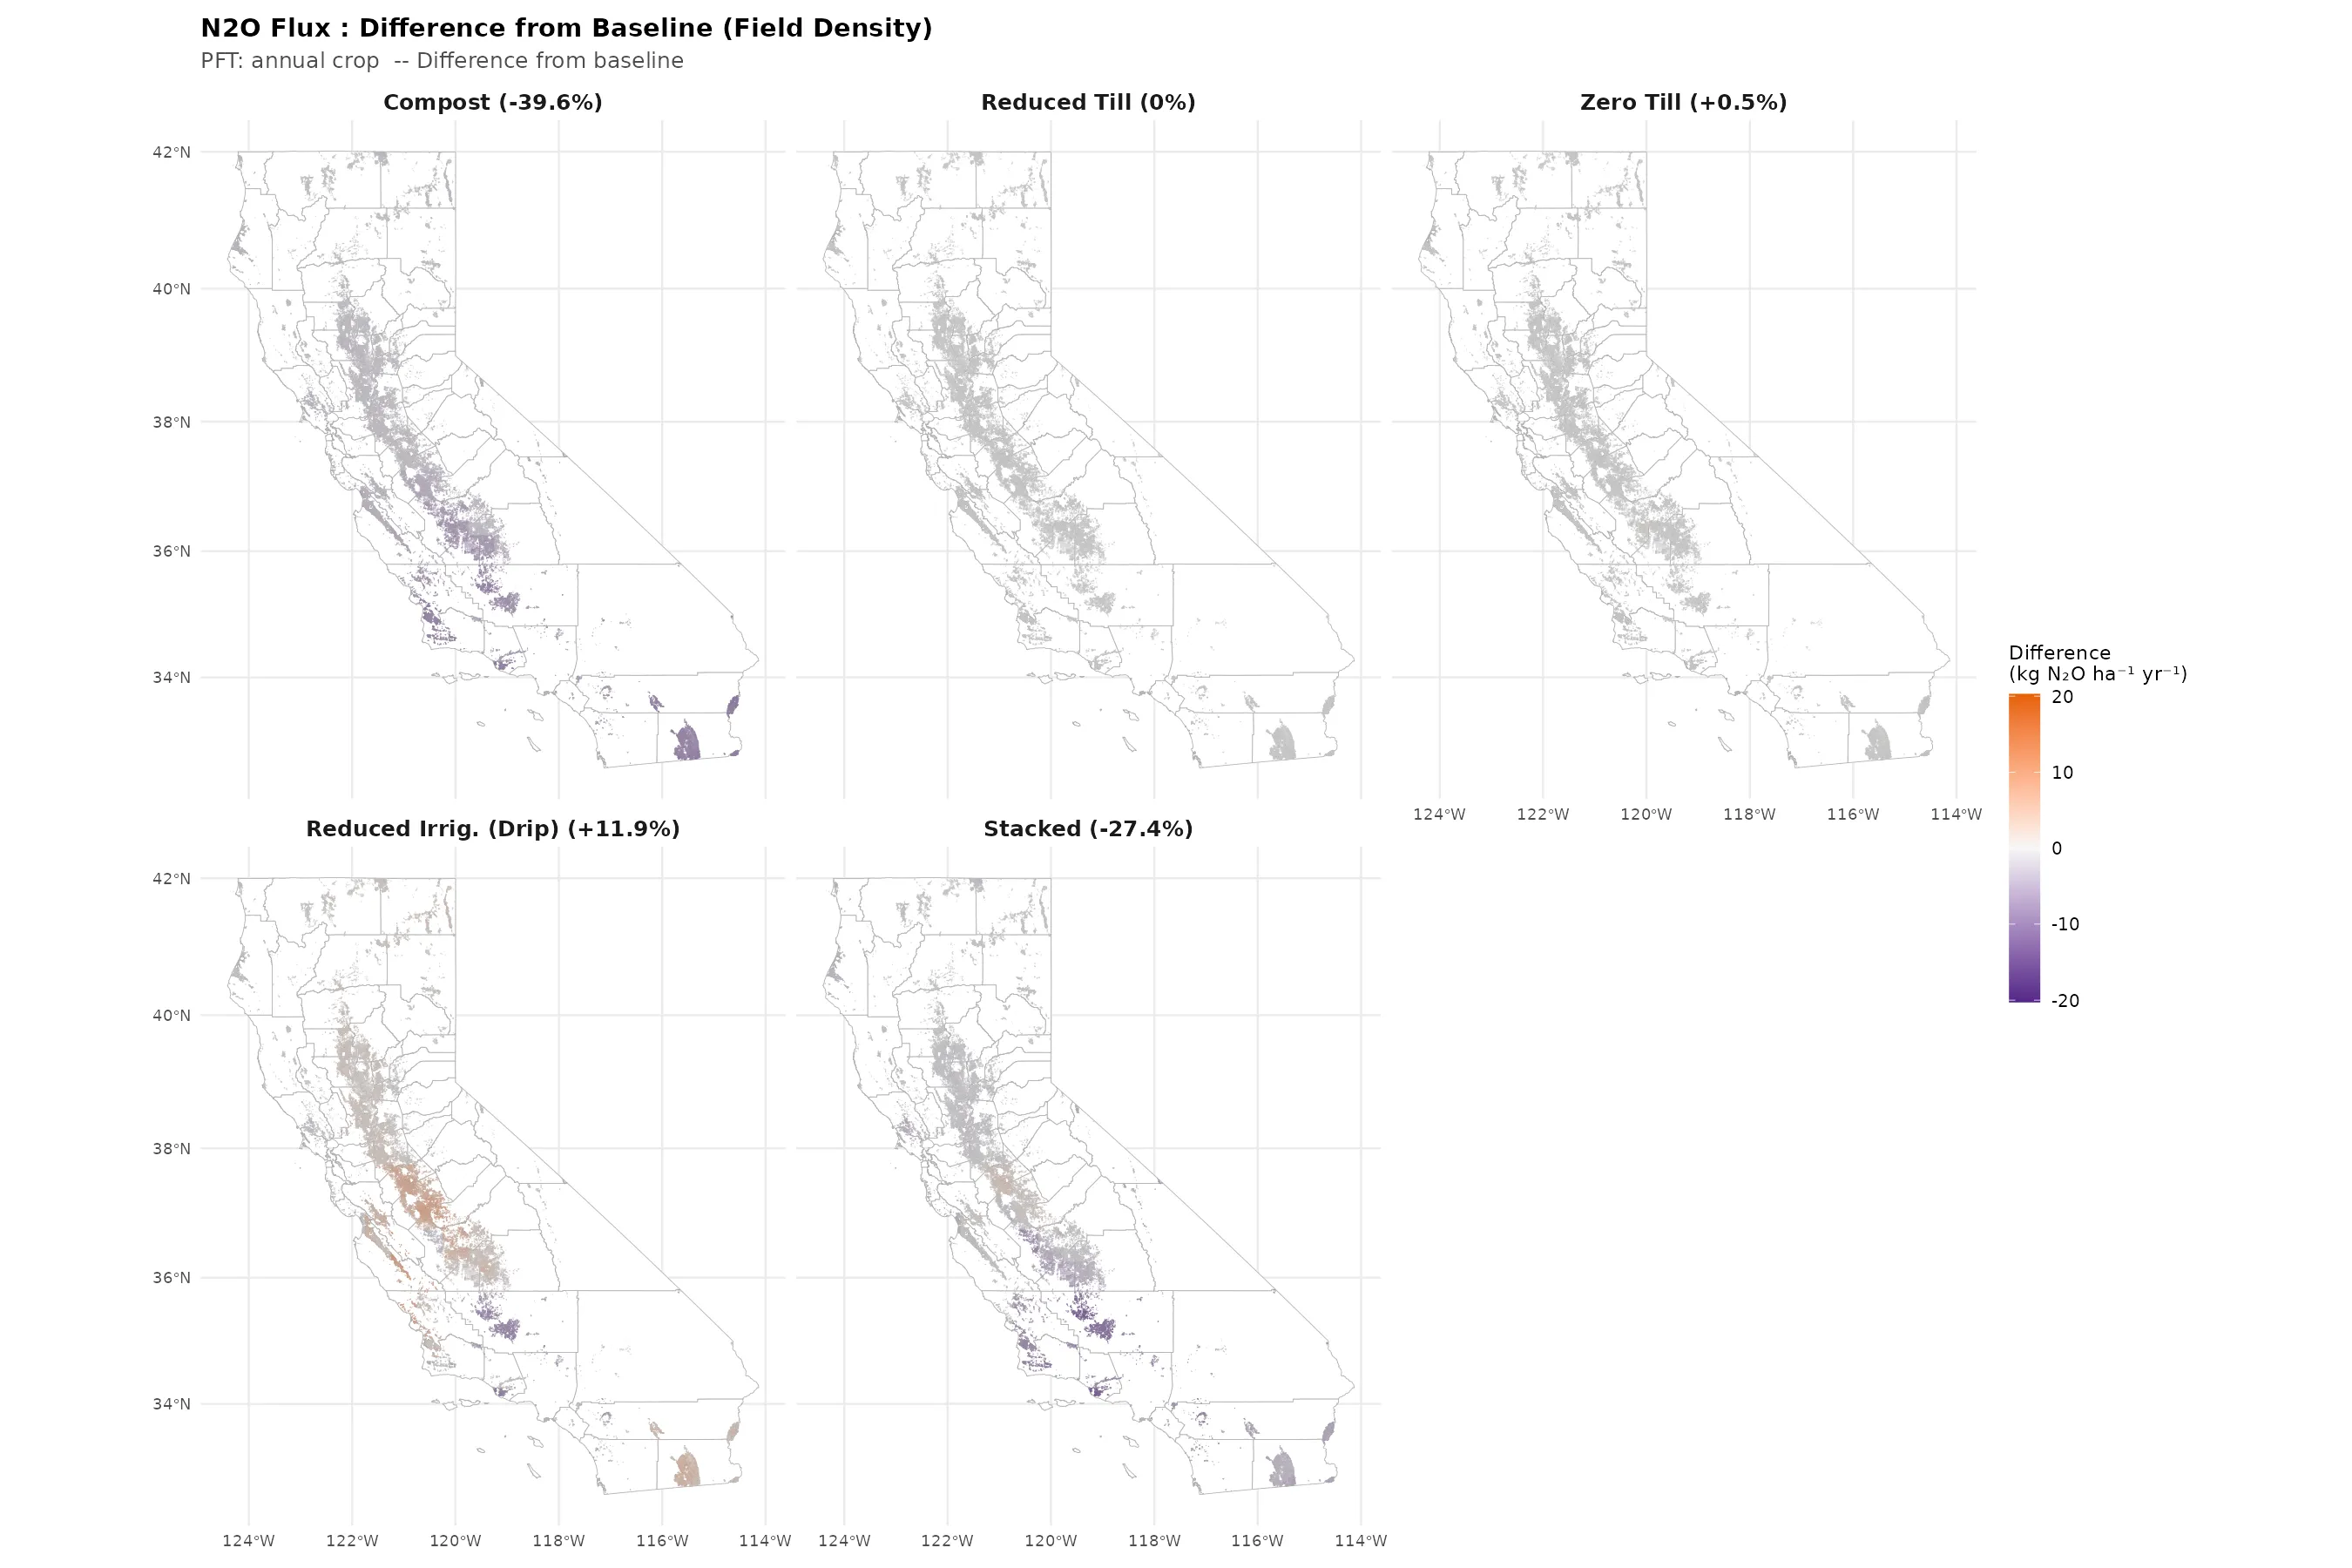
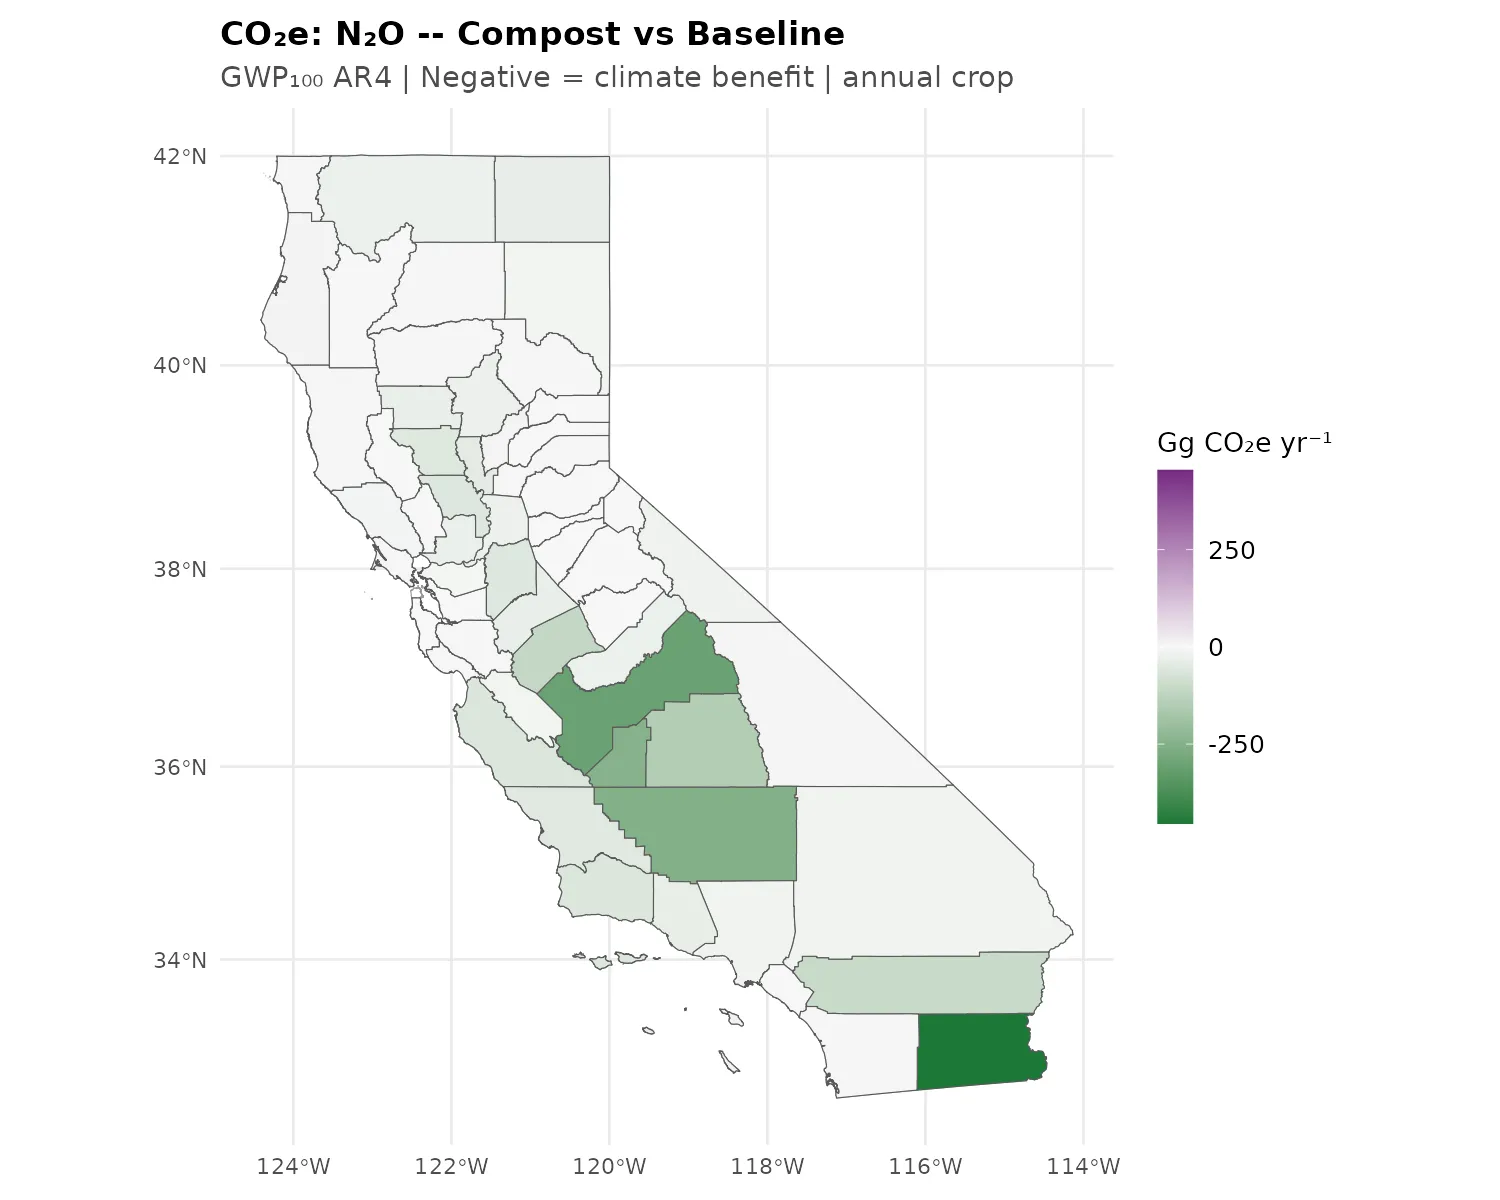
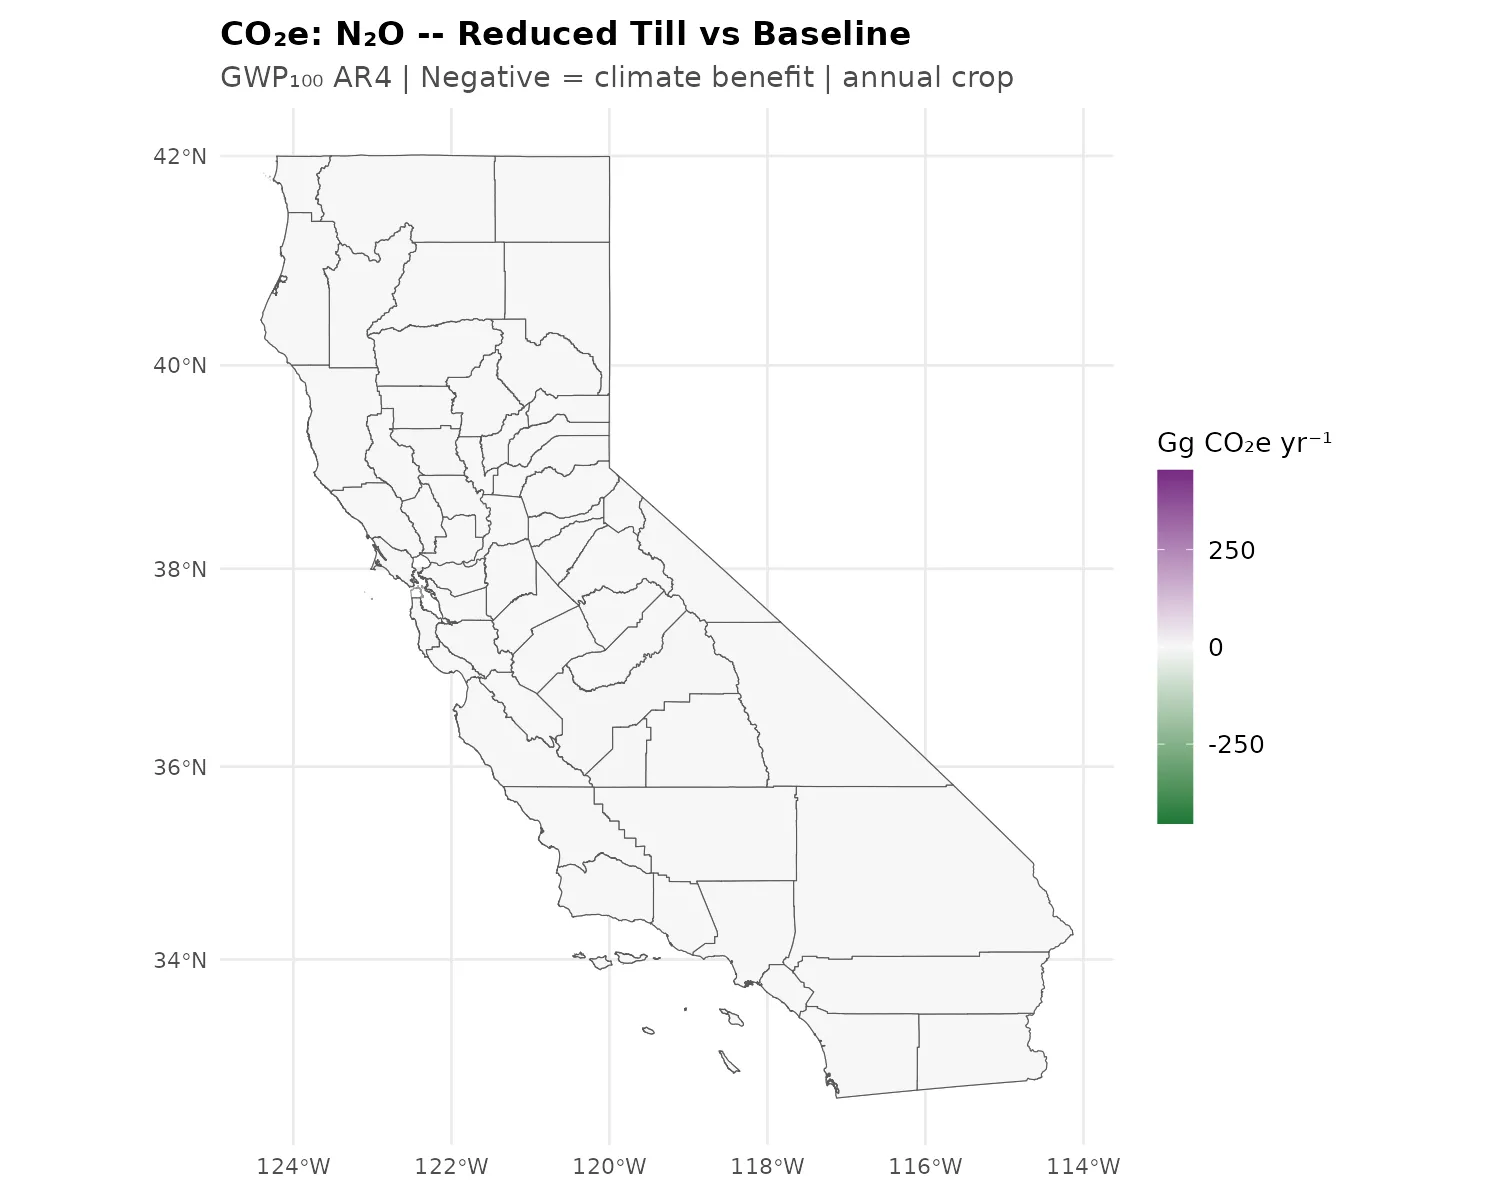
Individual N2O Difference Maps
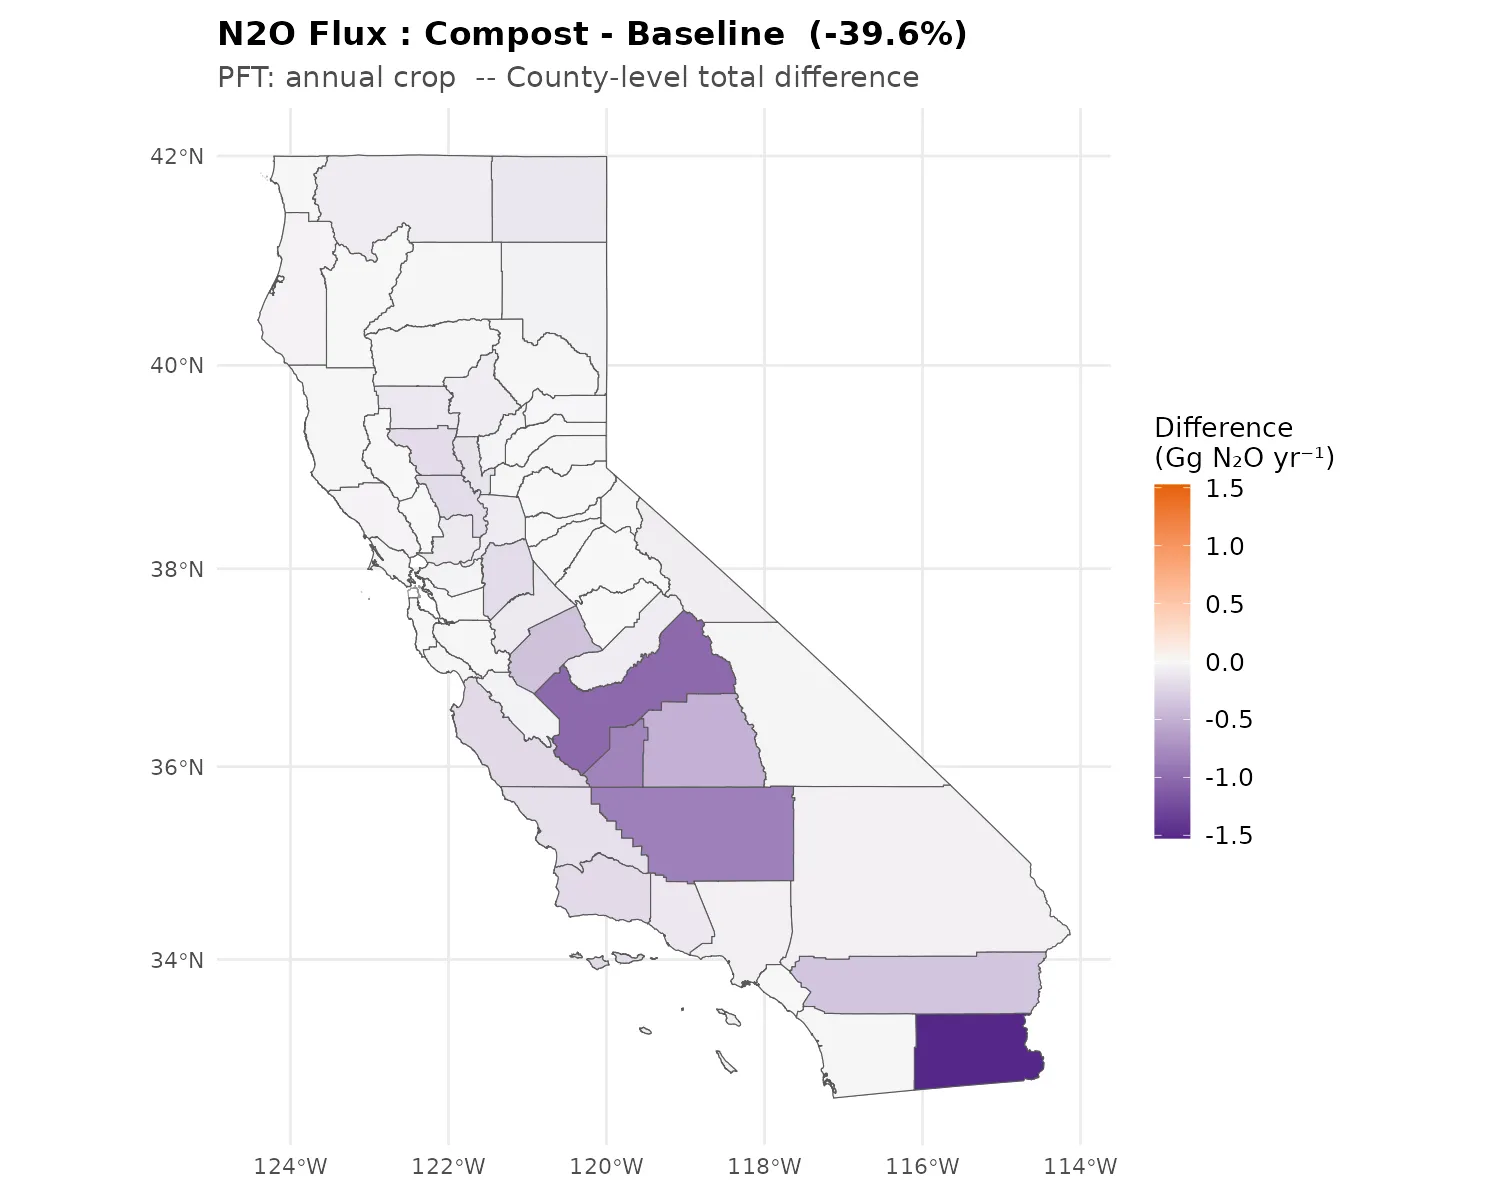
Compost reduces N2O by 39.5% statewide. This reduction is consistent with the mechanism of microbial N immobilization: mature compost with a high C:N ratio promotes assimilation of mineral N into microbial biomass, reducing the substrate available for nitrification and denitrification (Valkama et al. 2024, European Journal of Soil Science). Field studies in California almond orchards have shown compost + fertigation reducing N2O by ~50% (Khalsa et al. 2022). Our -39.5% is within this range, reflecting our assumption that compost replaces synthetic N inputs.
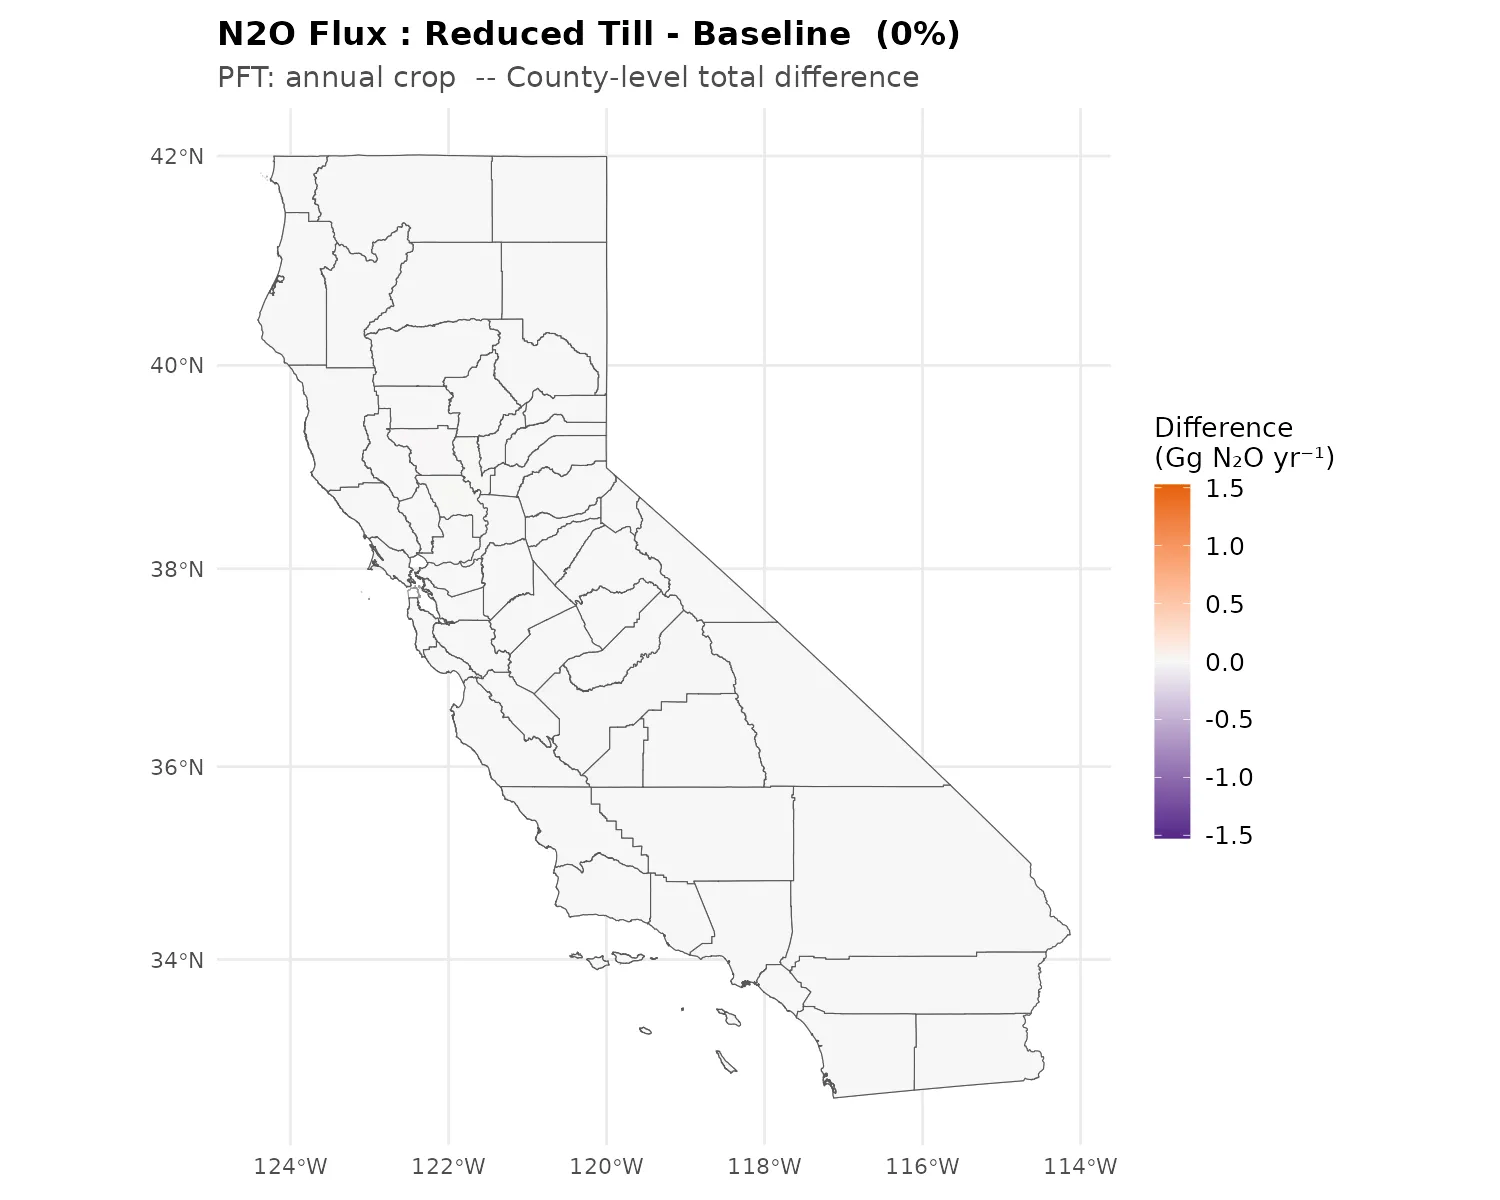
Essentially no change (+0.1%). The near-zero N2O response to tillage reduction is consistent with the van Kessel et al. (2013) meta-analysis, which found that N2O effects of no-till are highly variable and near zero in dry climates during the first decade of adoption.

Essentially no change (+0.5%). Similar to reduced till, the N2O response to zero tillage is negligible over 8 years in California’s semi-arid climate.
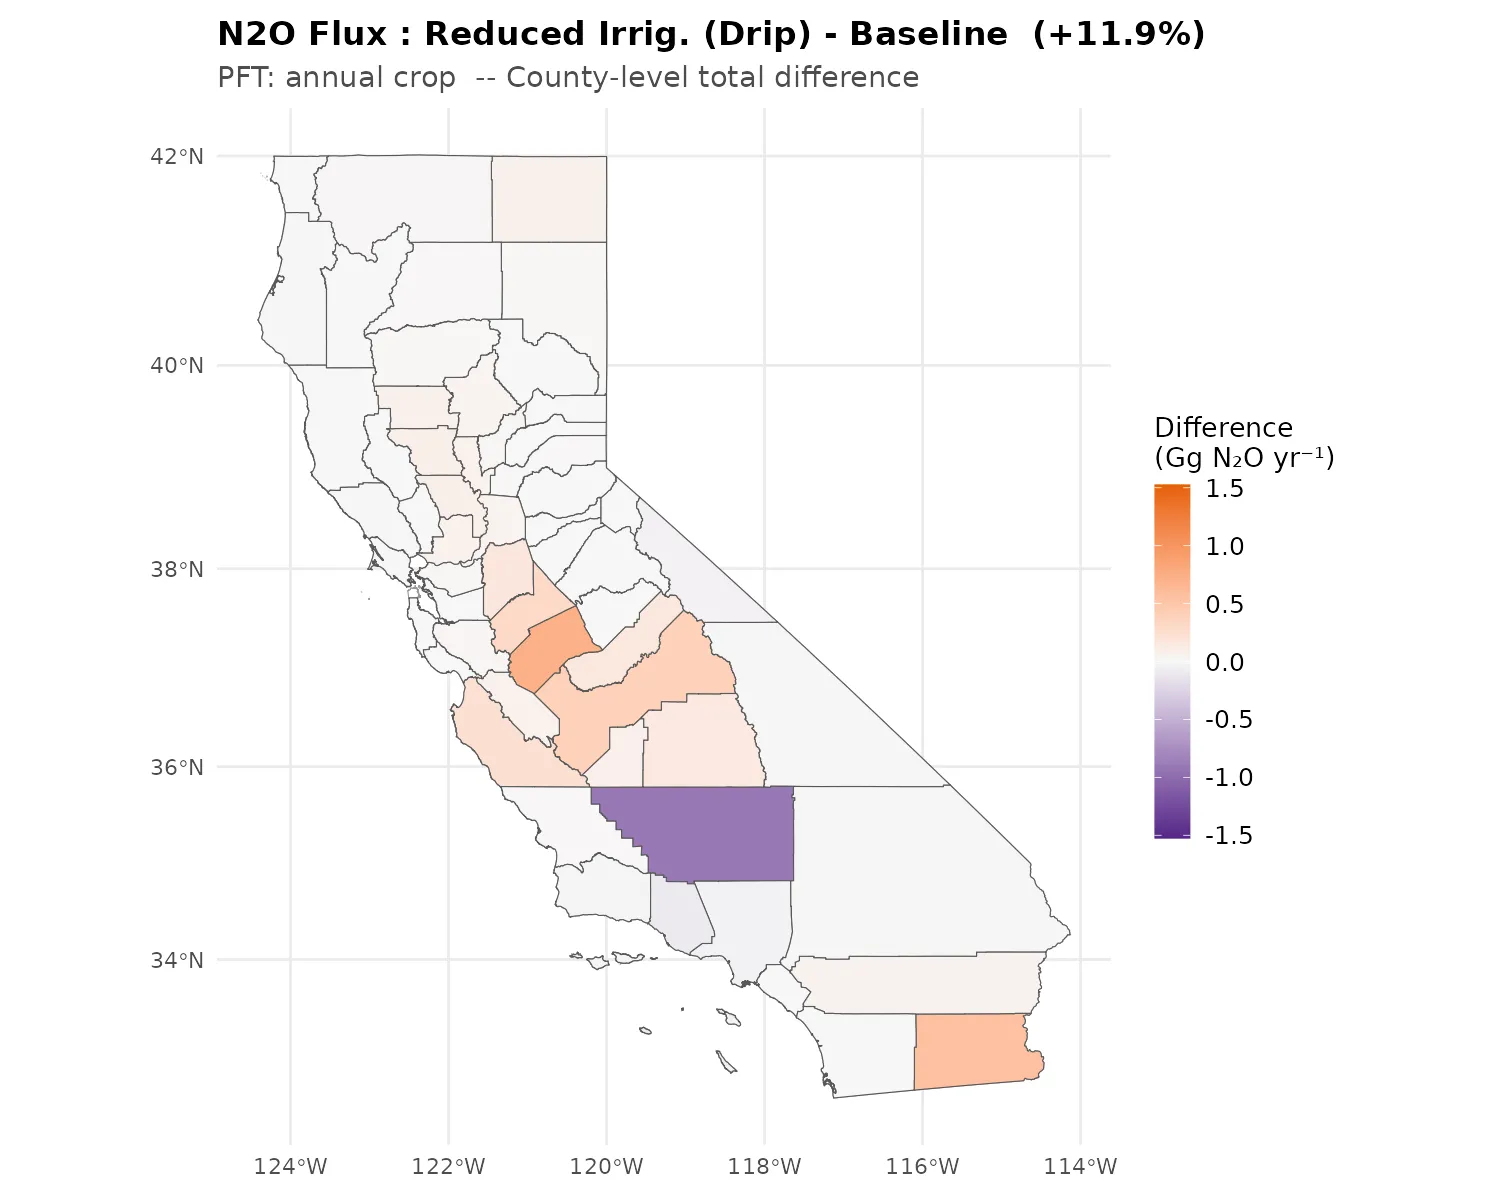
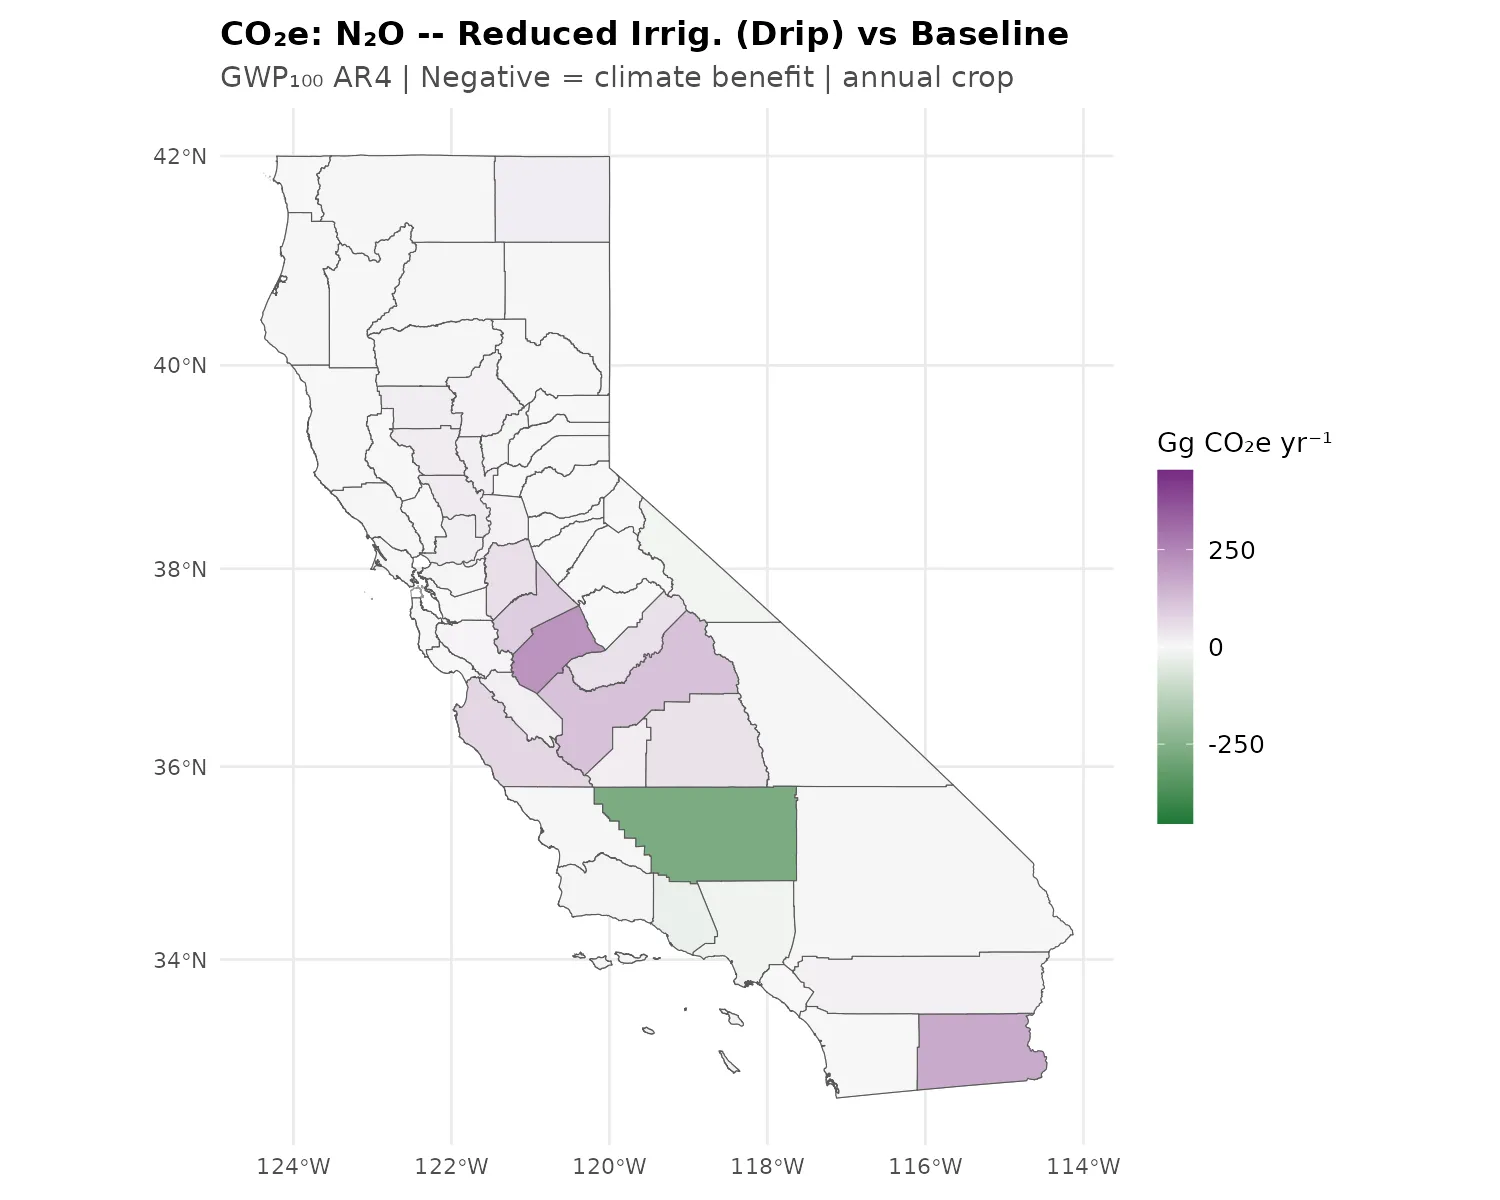
Increase (+12.0%). The modeled N2O increase under drip irrigation reflects SIPNET’s representation of intermediate soil moisture conditions that can favor nitrification pathways. This result should be interpreted with caution, as field studies report mixed findings depending on fertilizer type, application frequency, and soil conditions (Kuang et al. 2021, Global Change Biology). Some California field studies have shown drip + fertigation reducing N2O in tomato systems (Kennedy et al. 2013), while others show increases when fertigation concentrates N in the root zone.
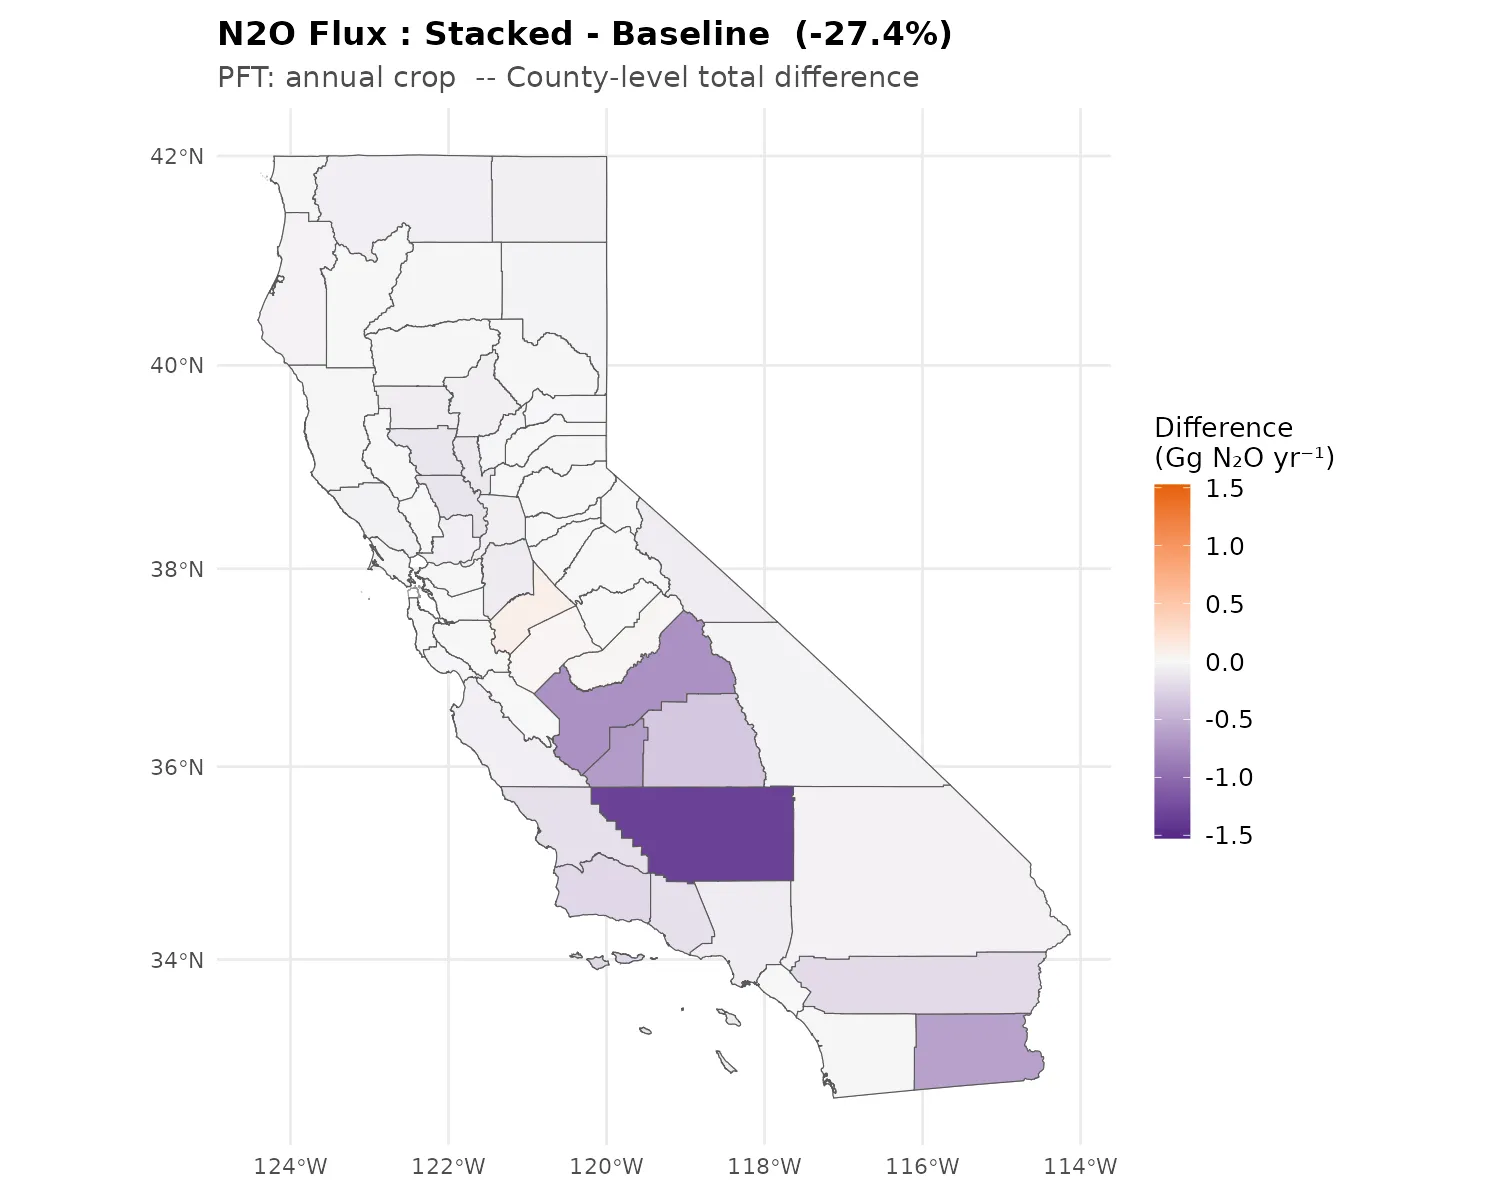
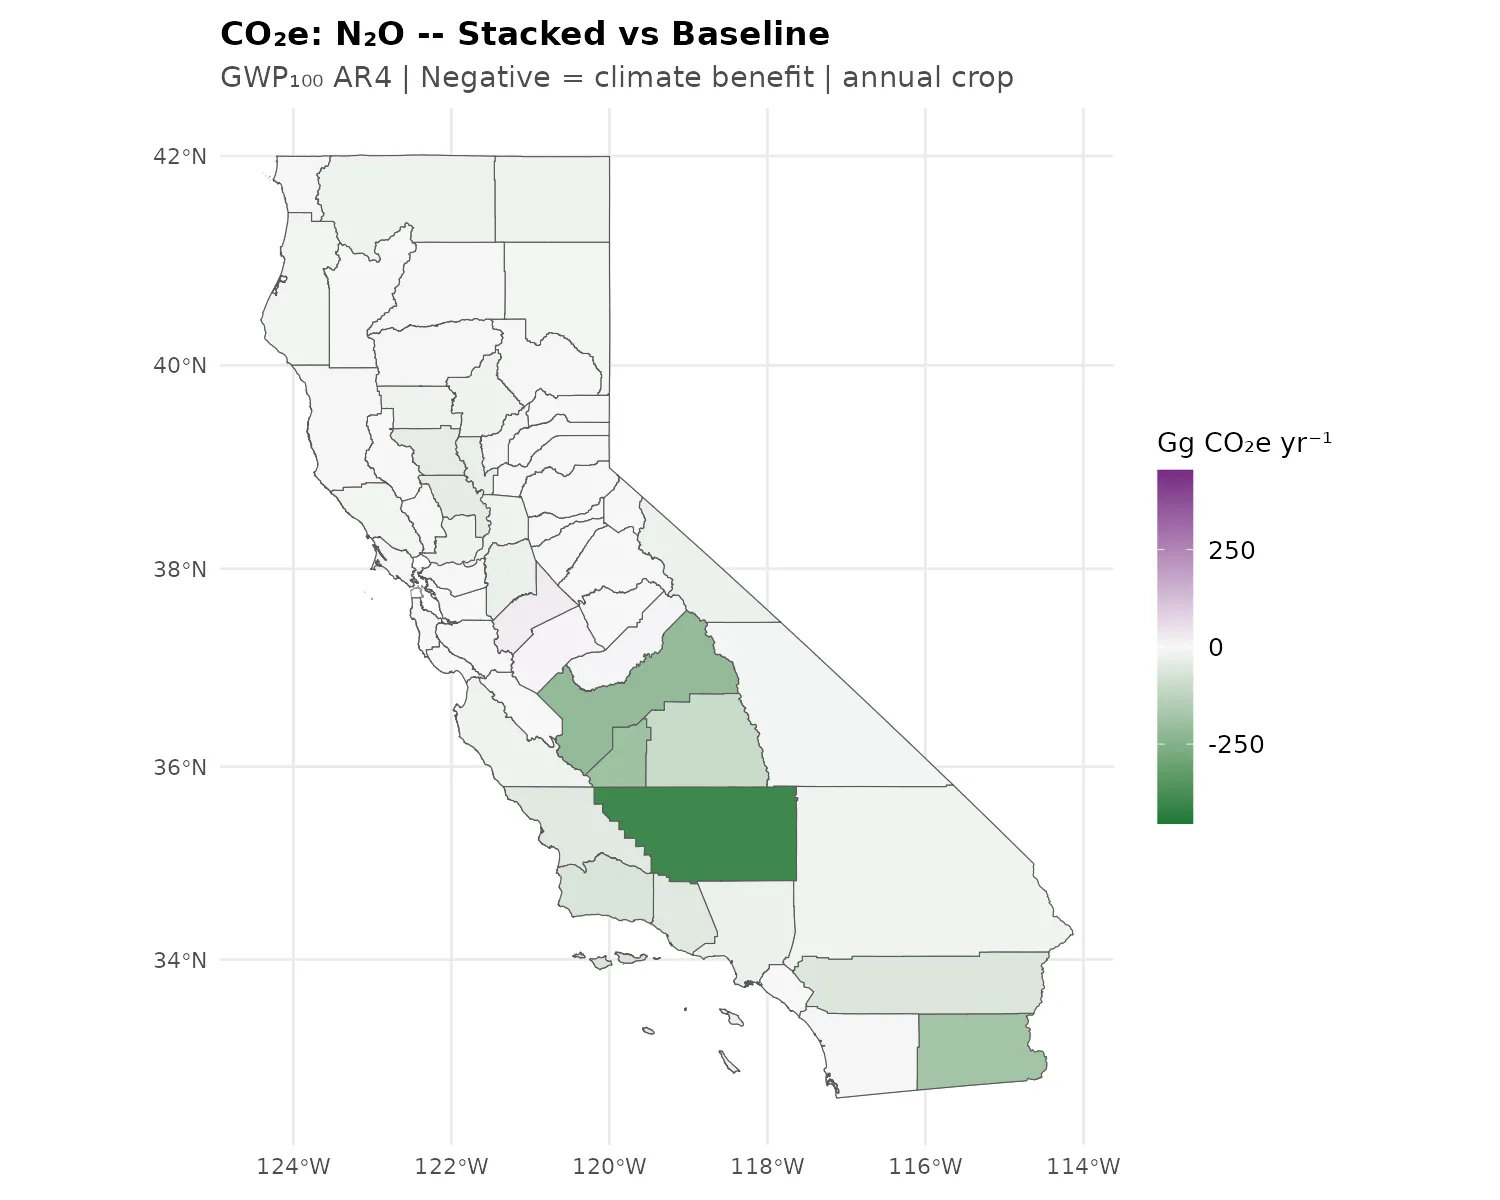
Large reduction (-27.3%). The stacked scenario combines compost’s N immobilization effect with drip irrigation’s moisture regulation, producing a net N2O reduction dominated by the compost mechanism. The smaller magnitude compared to compost alone (-39.5%) reflects the partially offsetting N2O increase from drip irrigation (+12.0%).
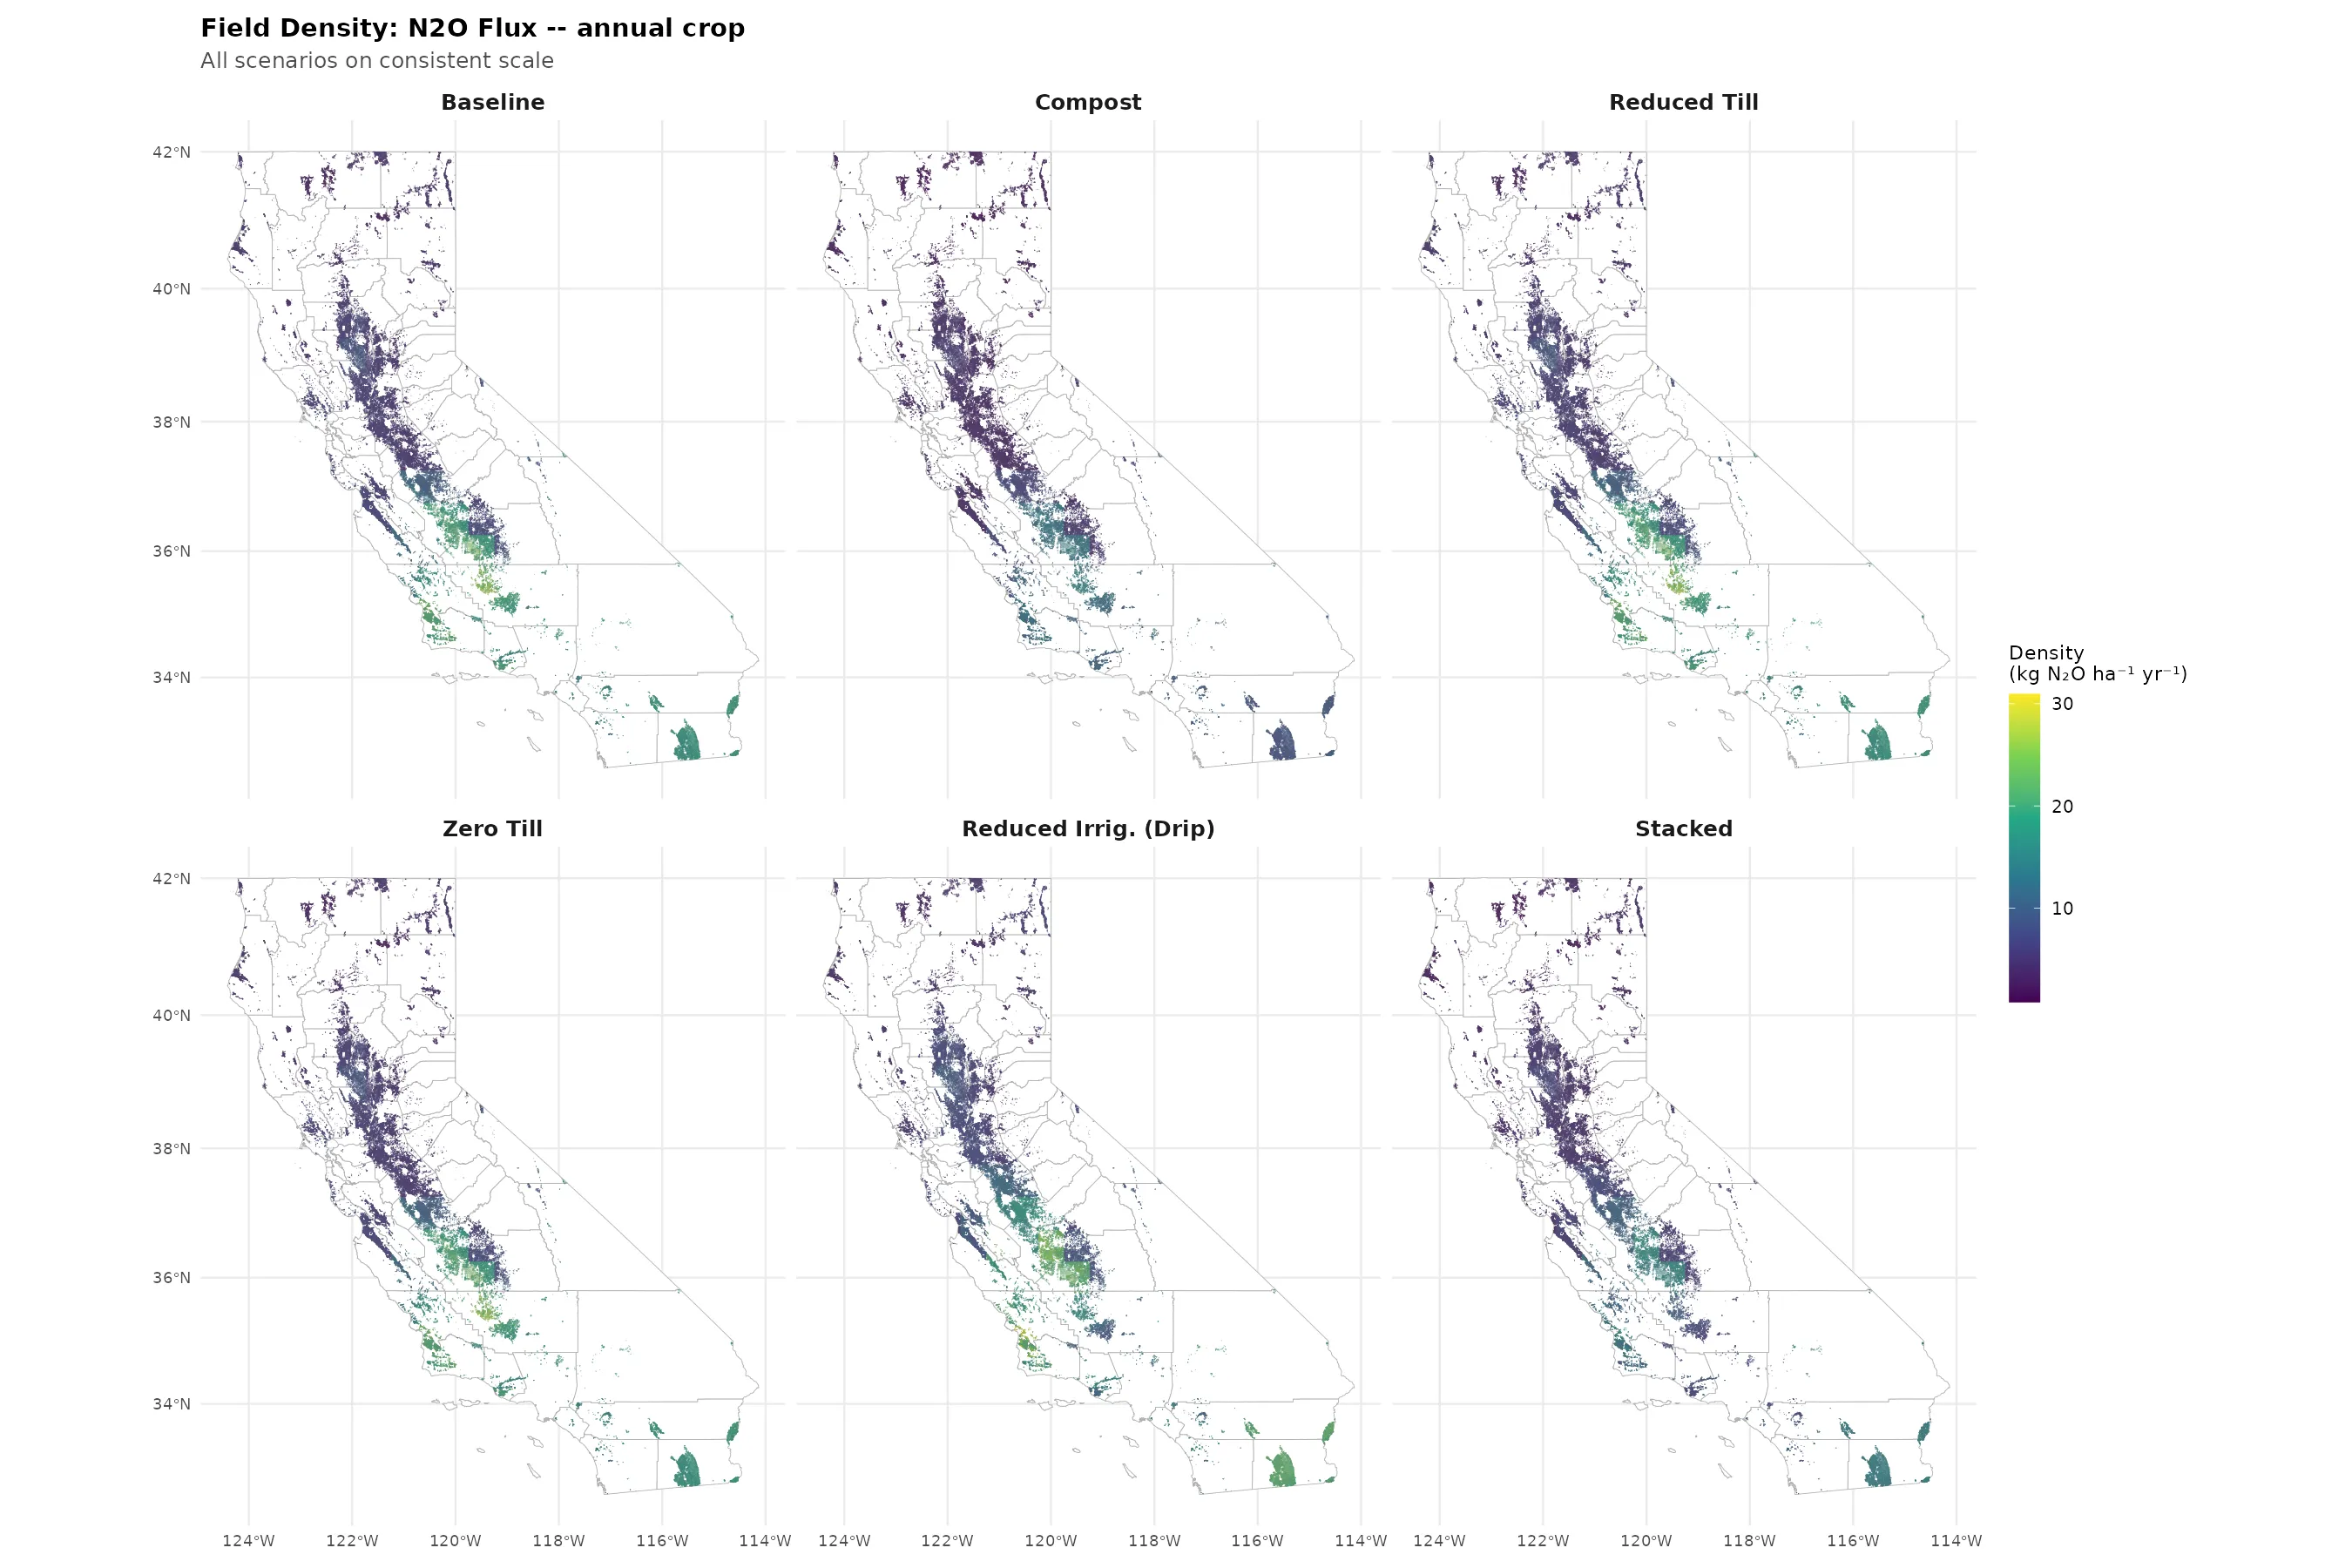
Field-Level N2O
Methane (CH4) Emissions
CH4 is a potent greenhouse gas (~25x CO2 over 100 years, GWP100 AR4; IPCC 2007; ~72x over 20 years). Agricultural soils can be sources or sinks of methane depending on soil moisture, oxygen availability, and organic carbon substrate. Methanogenesis (CH4 production) occurs under anaerobic conditions; methanotrophy (CH4 consumption) occurs in well-aerated soils.
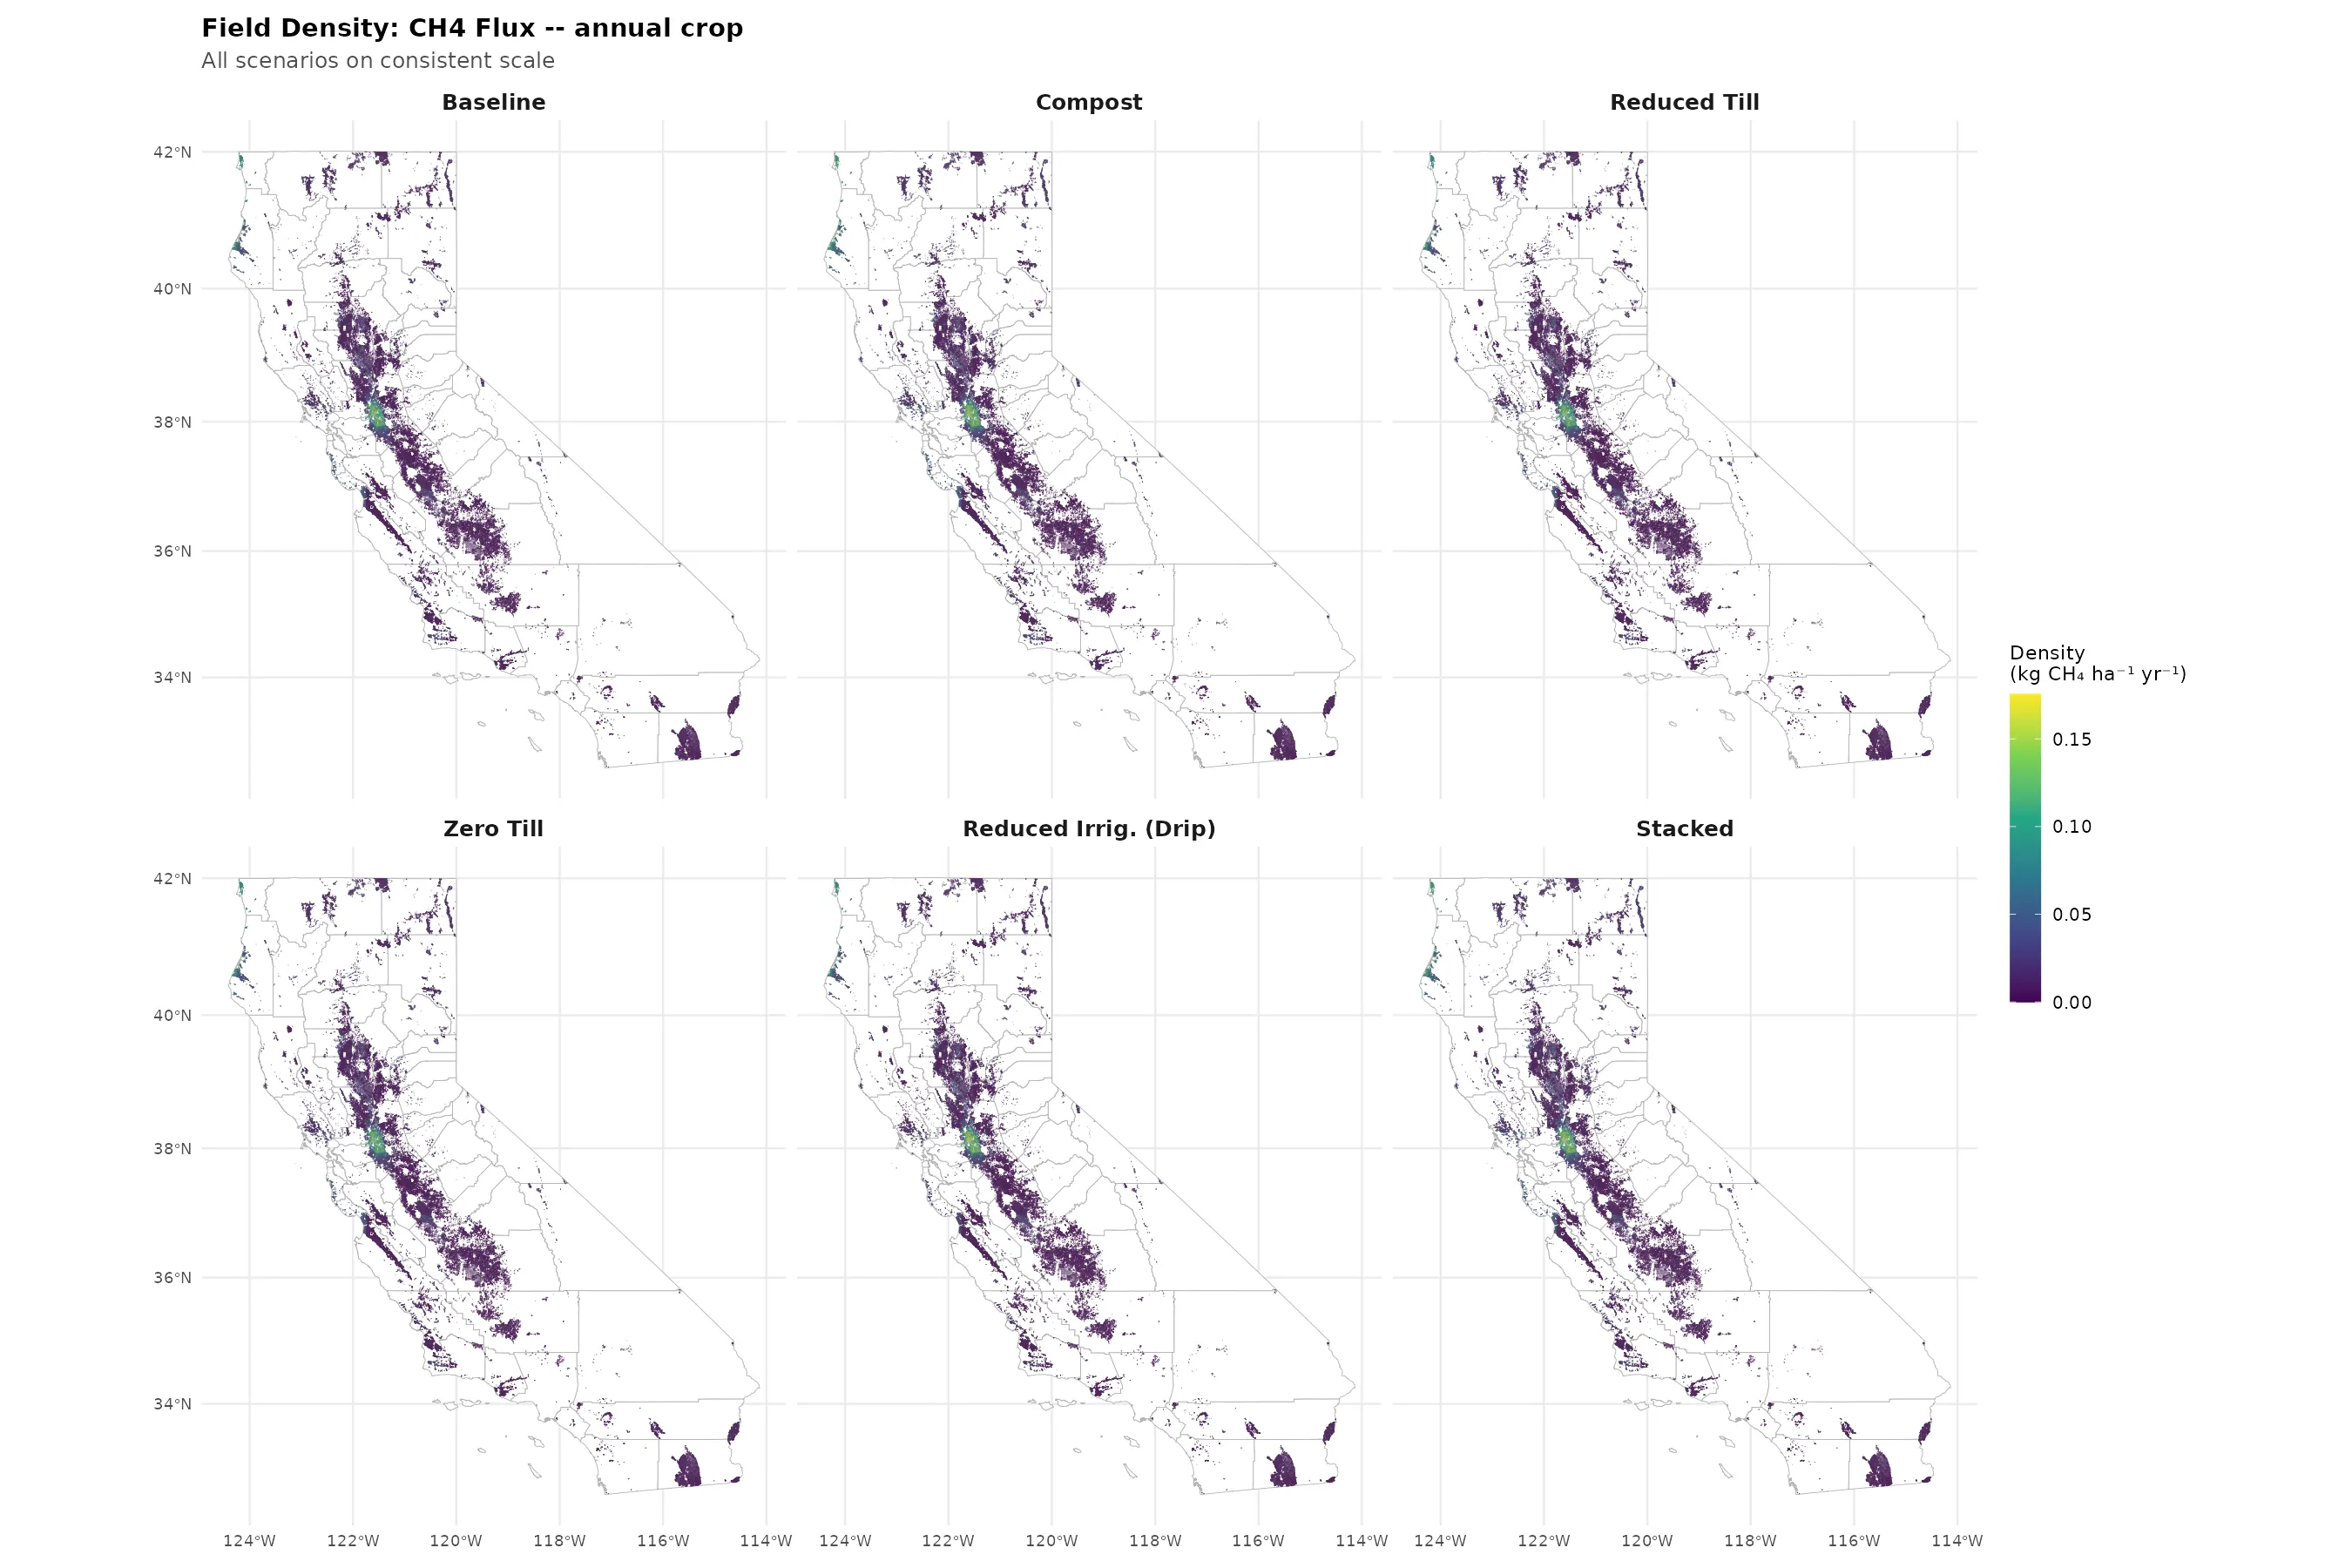
Combined View: Baseline + Scenario Differences
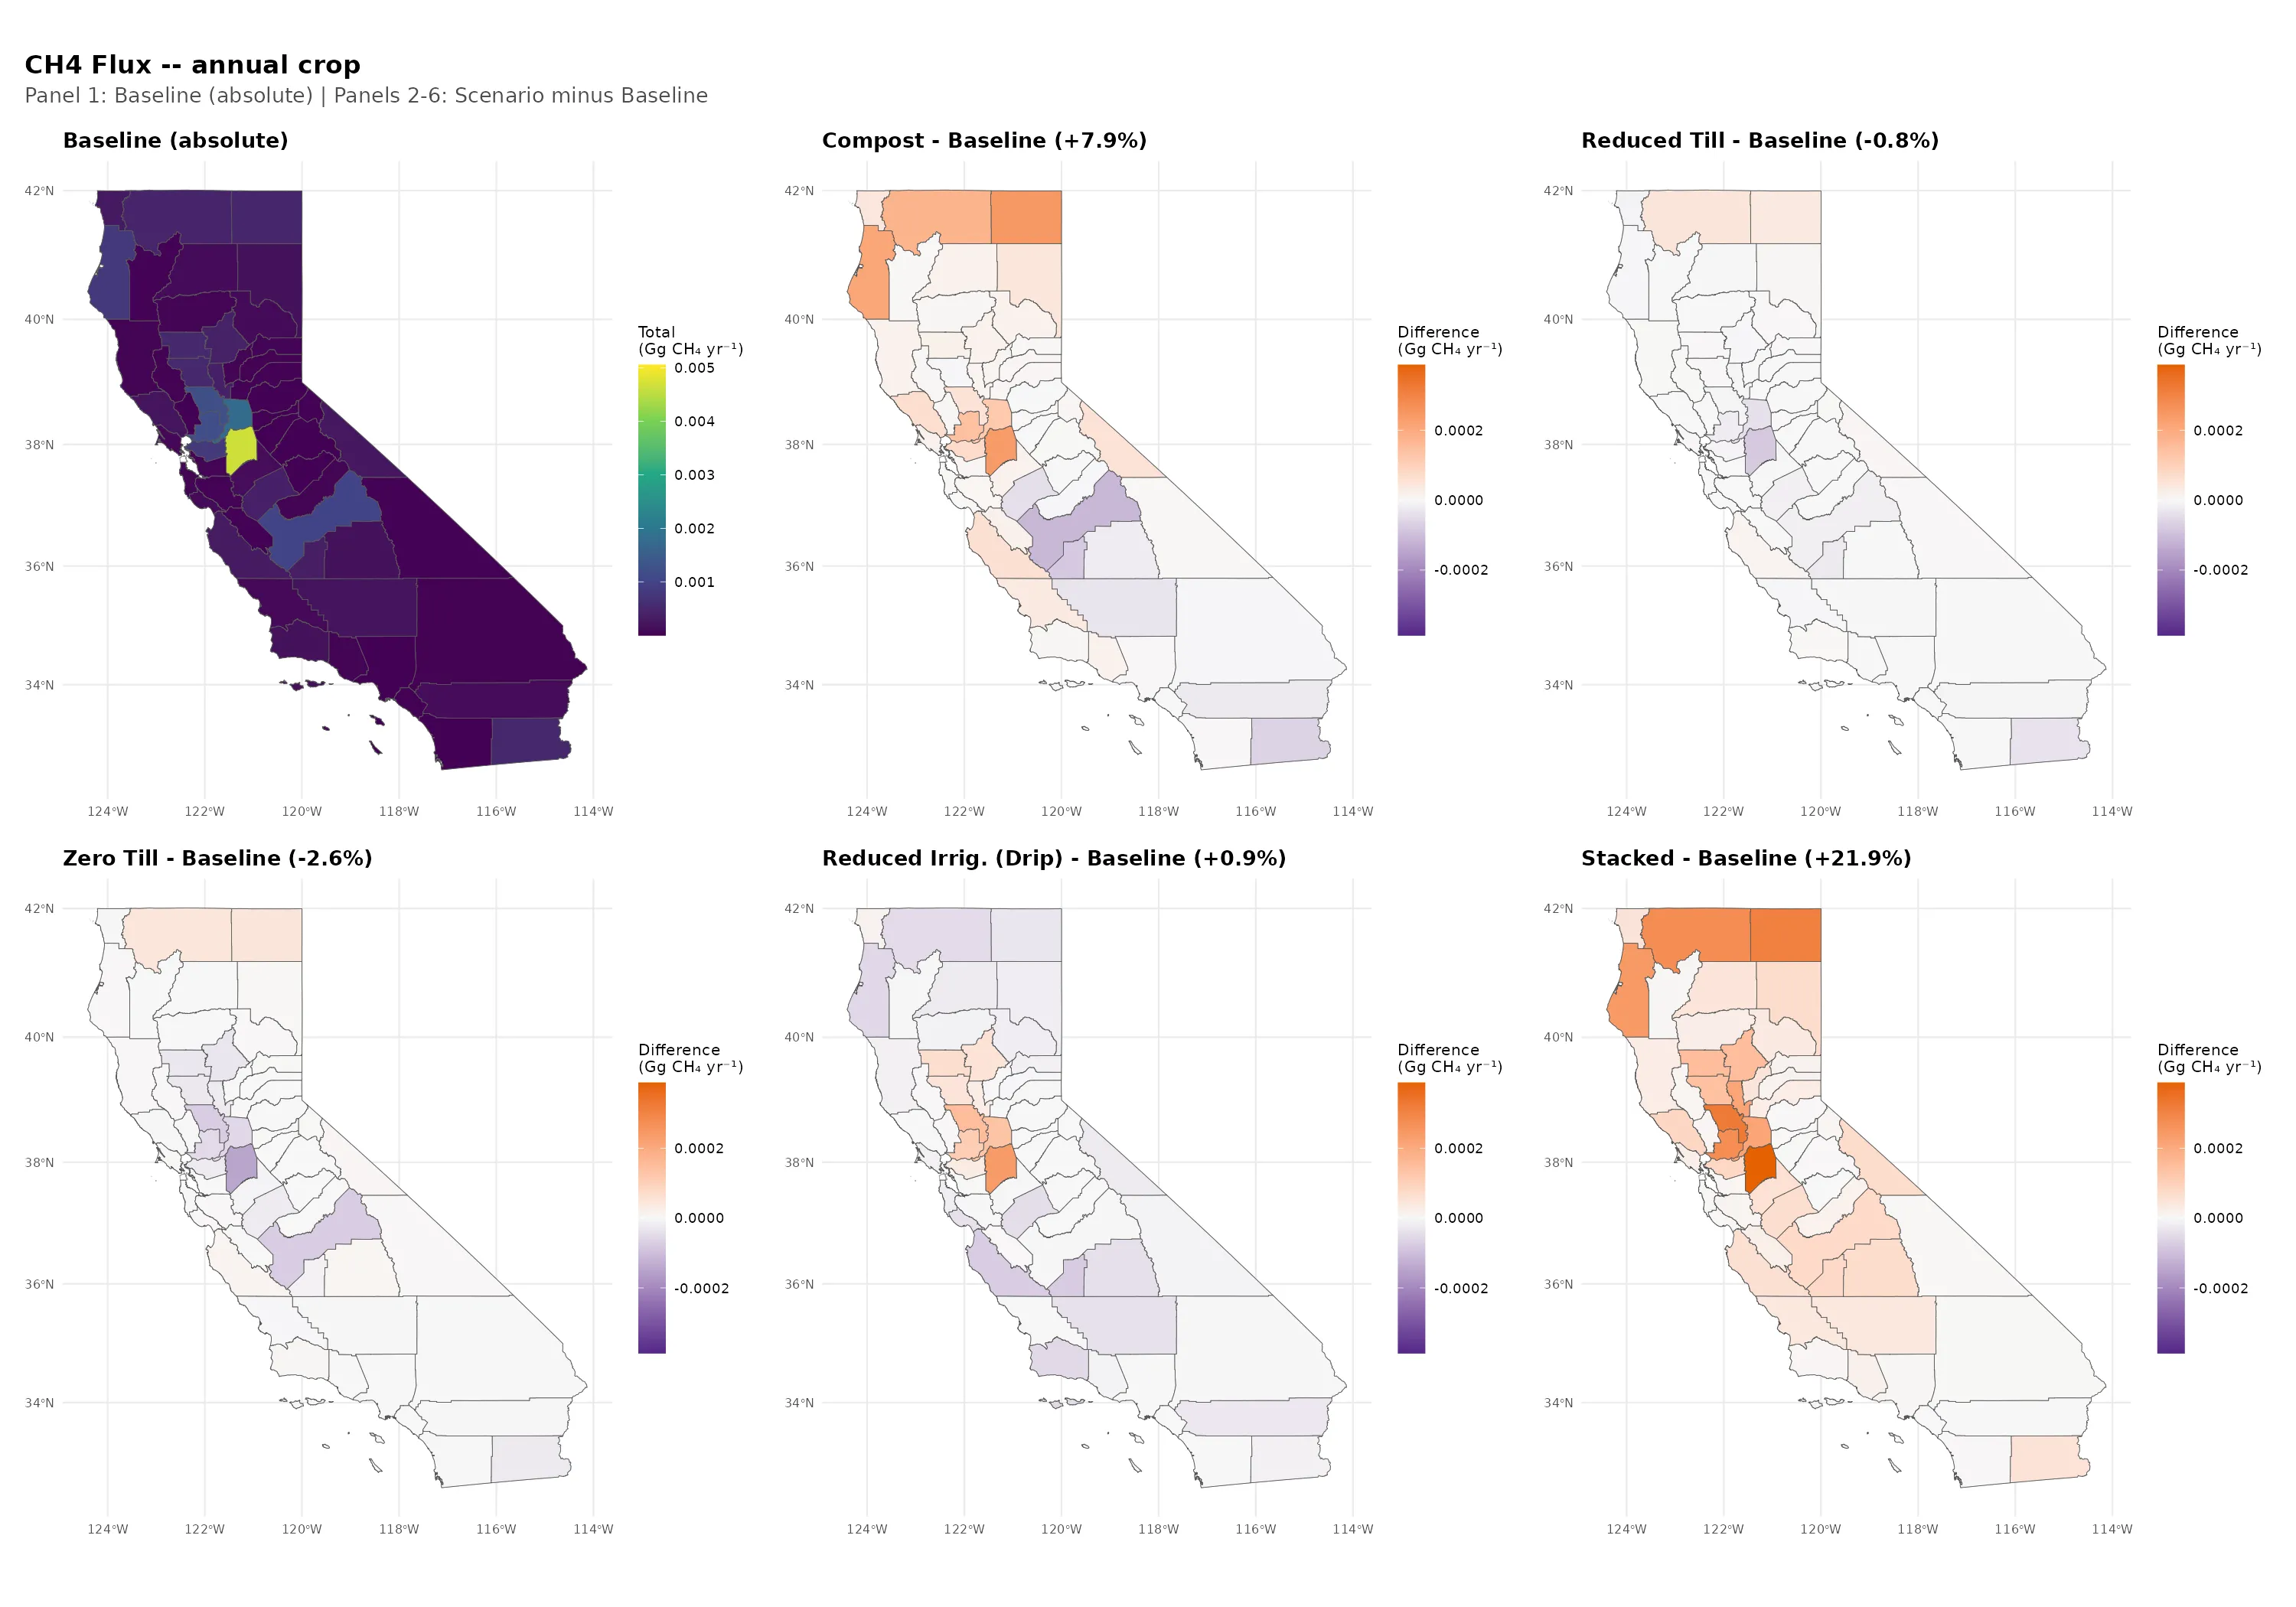
Methanogenesis requires sustained anaerobic conditions (continuous flooding) that do not occur in non-flooded annual croplands. Raw SIPNET CH4 flux is approximately 1.8 x 10⁻¹⁴ kg m⁻² – effectively machine-precision zero. The statewide CH4 baseline is 0.014 Gg CH4 yr⁻¹ (0.007 kg CH4 ha⁻¹ yr⁻¹) in downscaled predictions, where the non-zero values reflect Random Forest spatial noise fitting to essentially zero training data (OOB R² = -0.15). All scenario differences are therefore artifacts, not real signals. Percentage changes from a near-zero baseline are misleading and should not be interpreted. Meaningful CH4 fluxes are expected when rice paddies are included in future model runs.
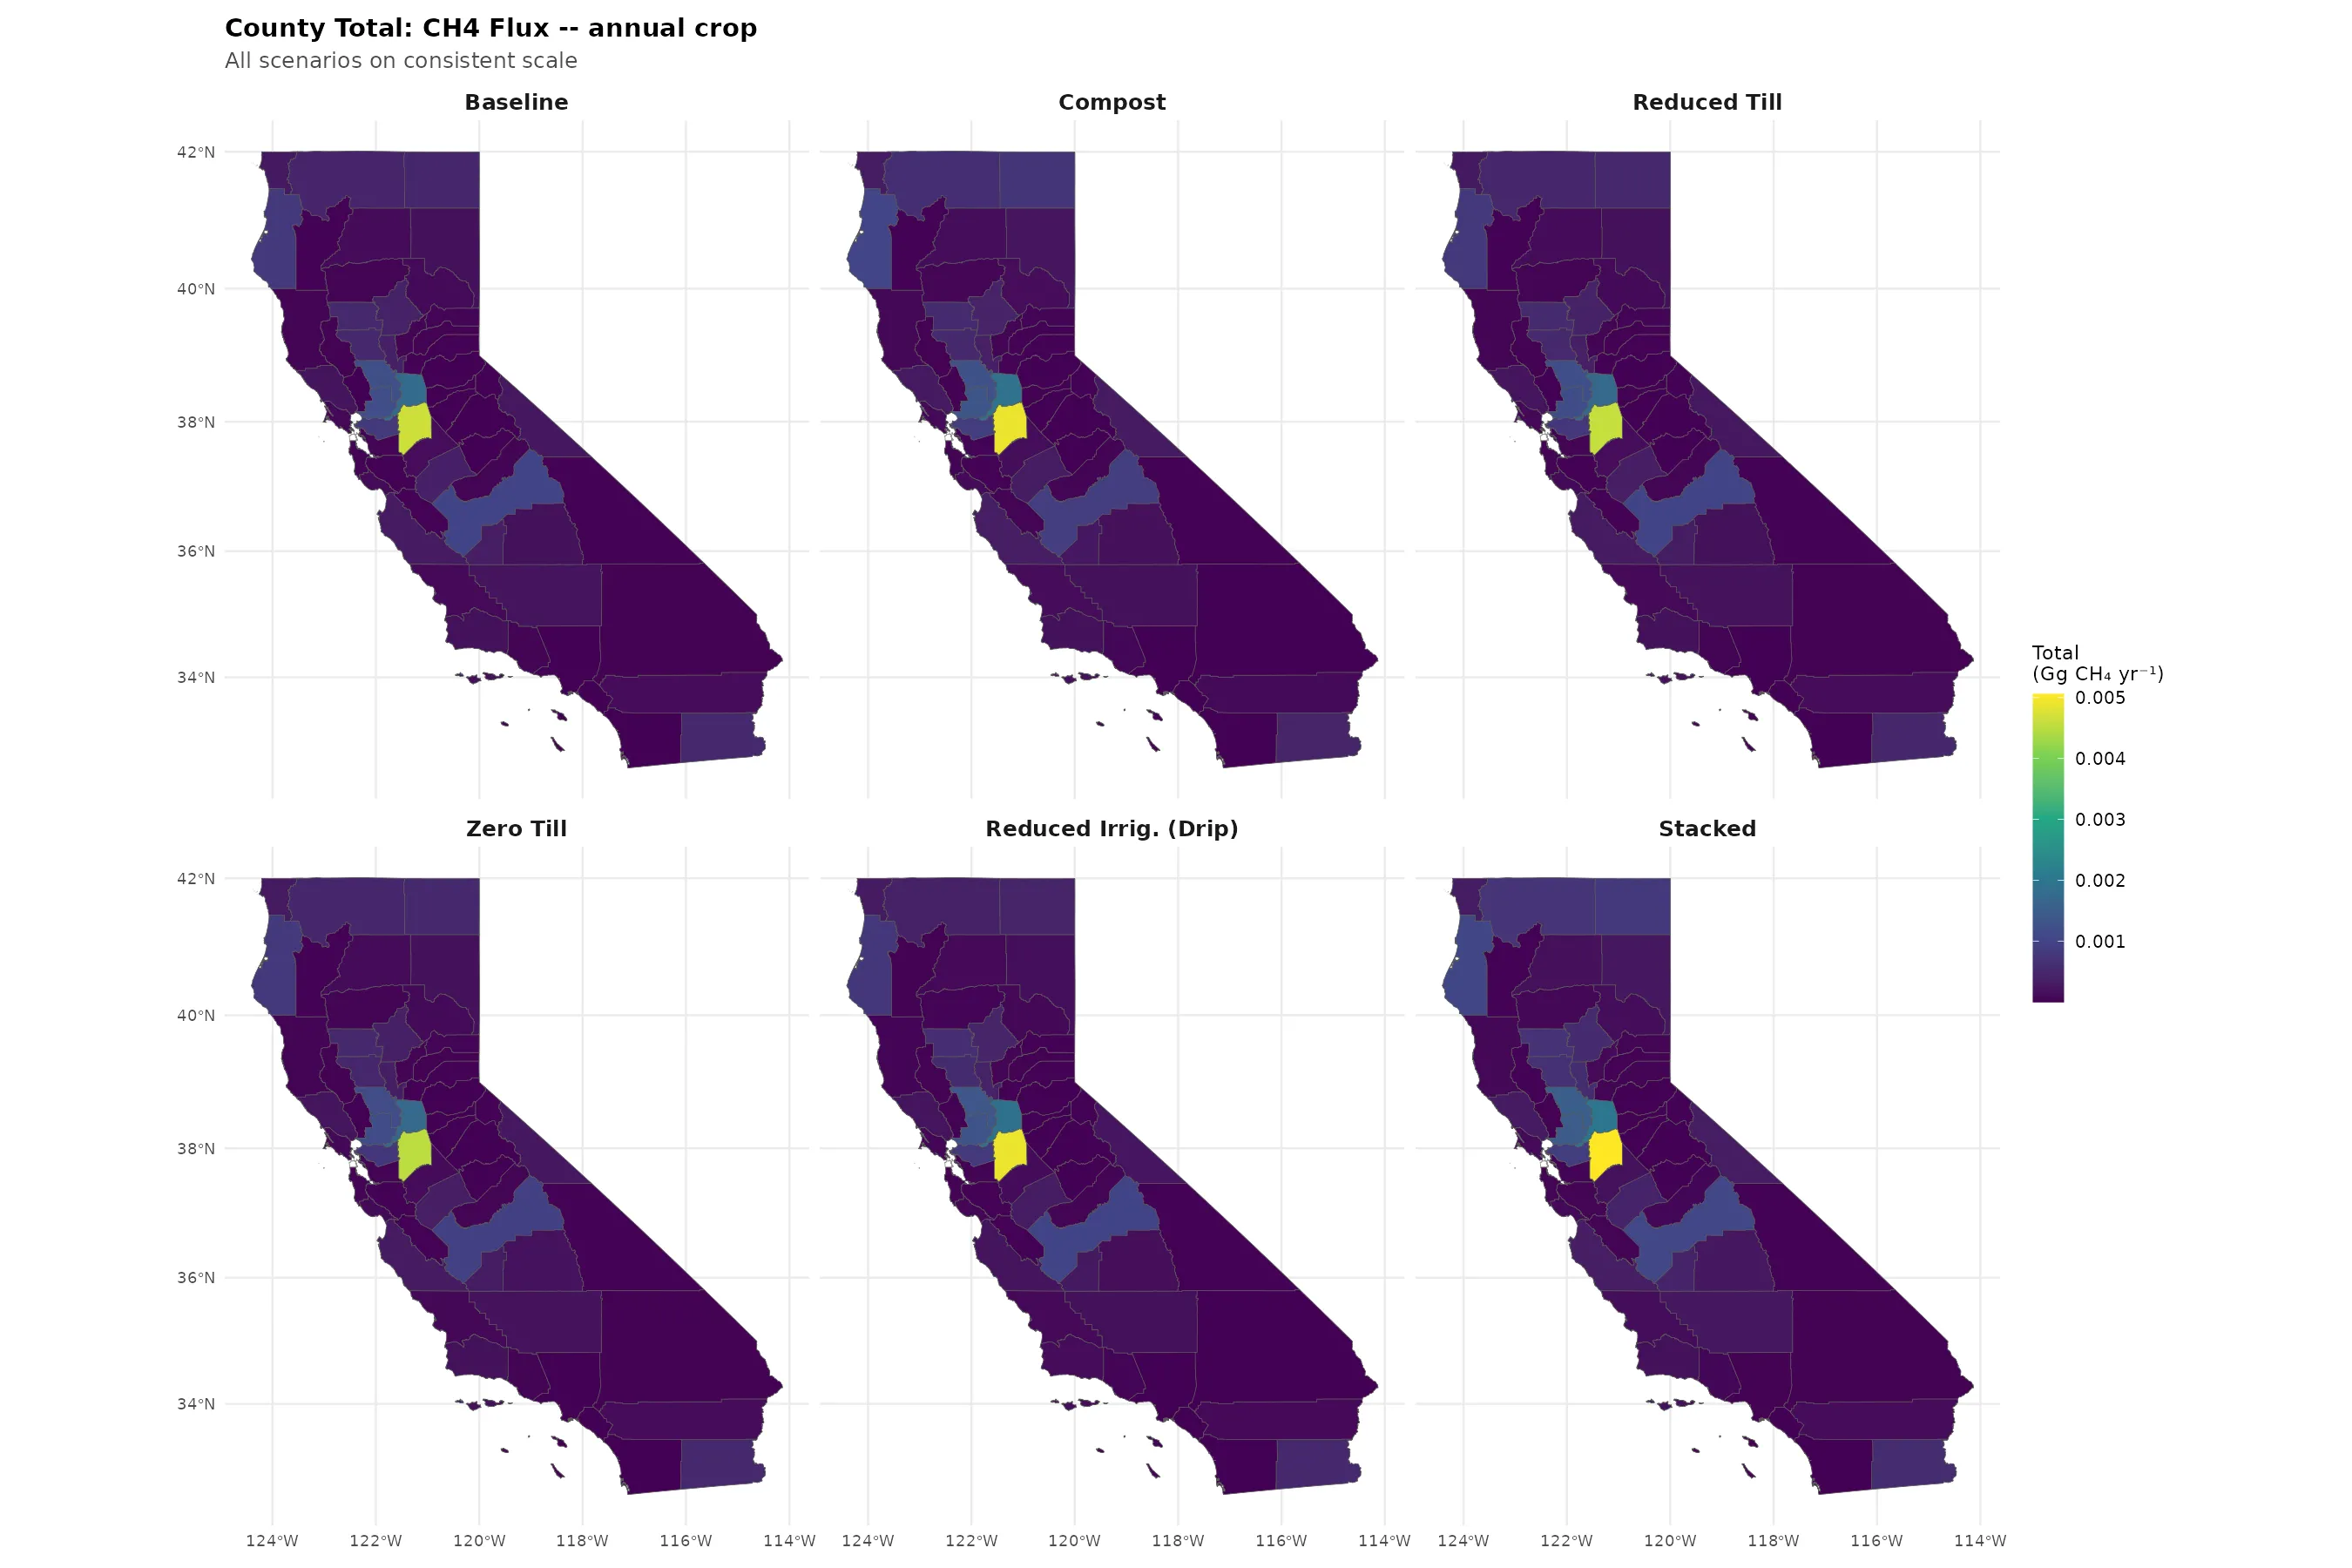
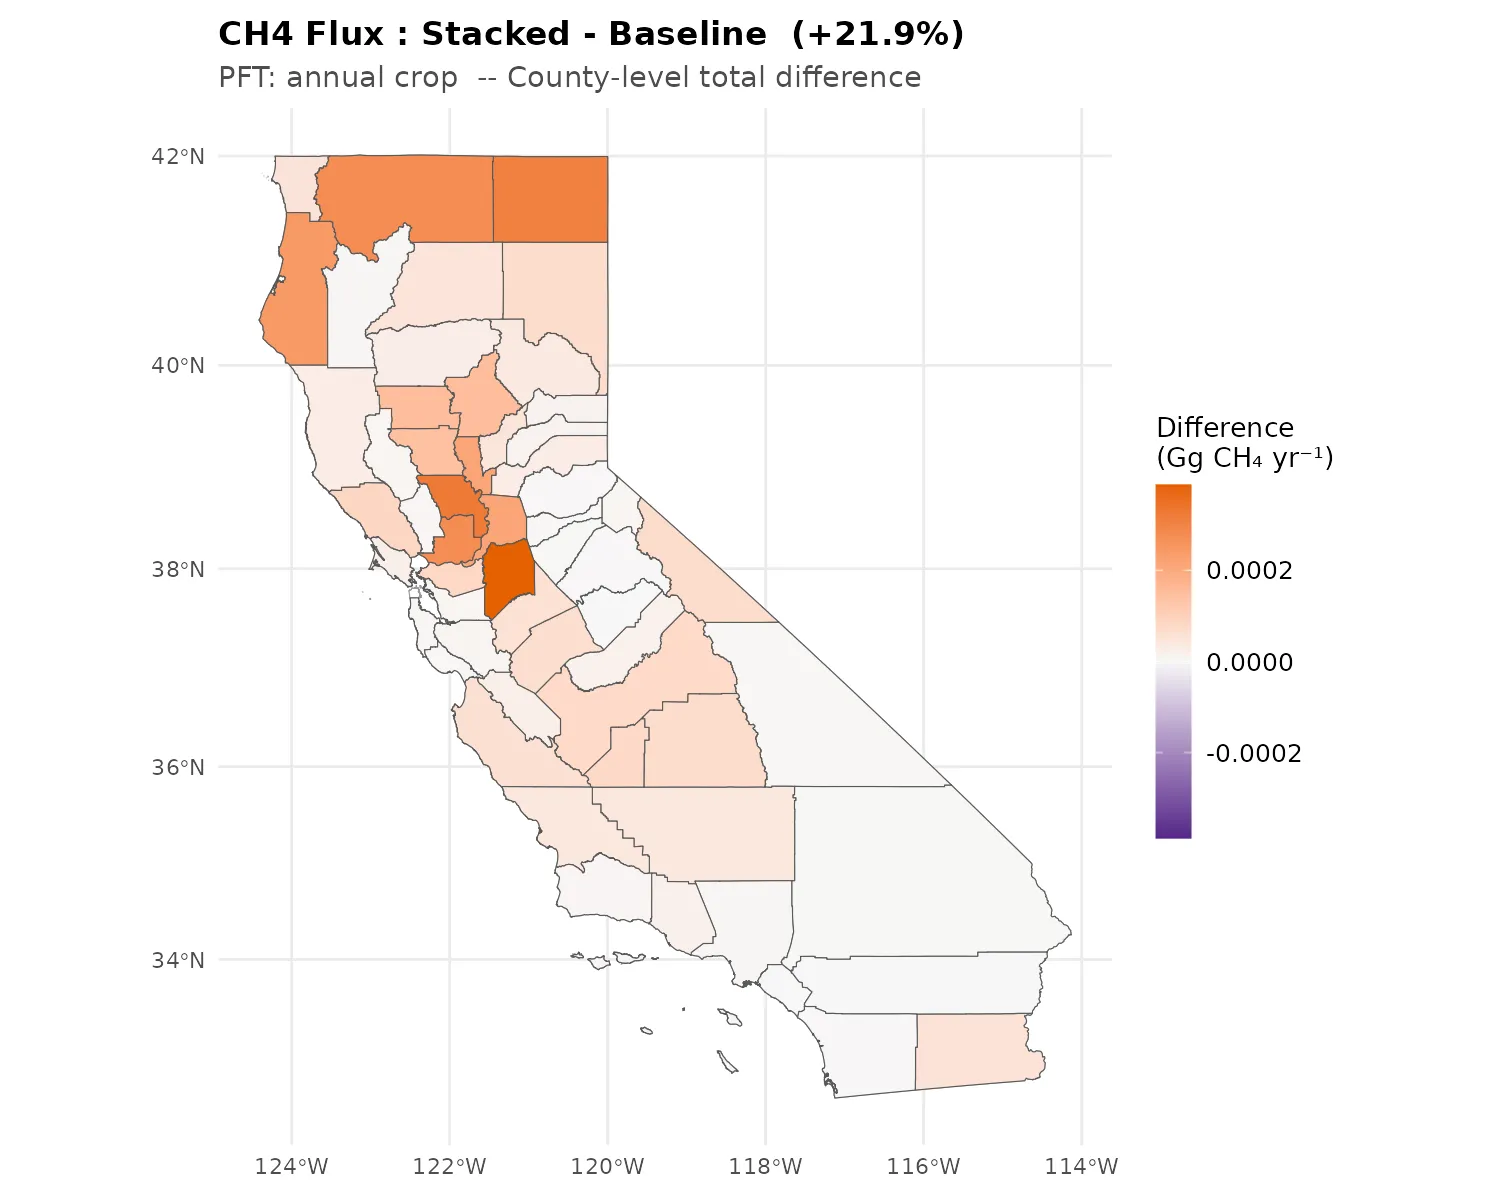
County-Level CH4: All Scenarios
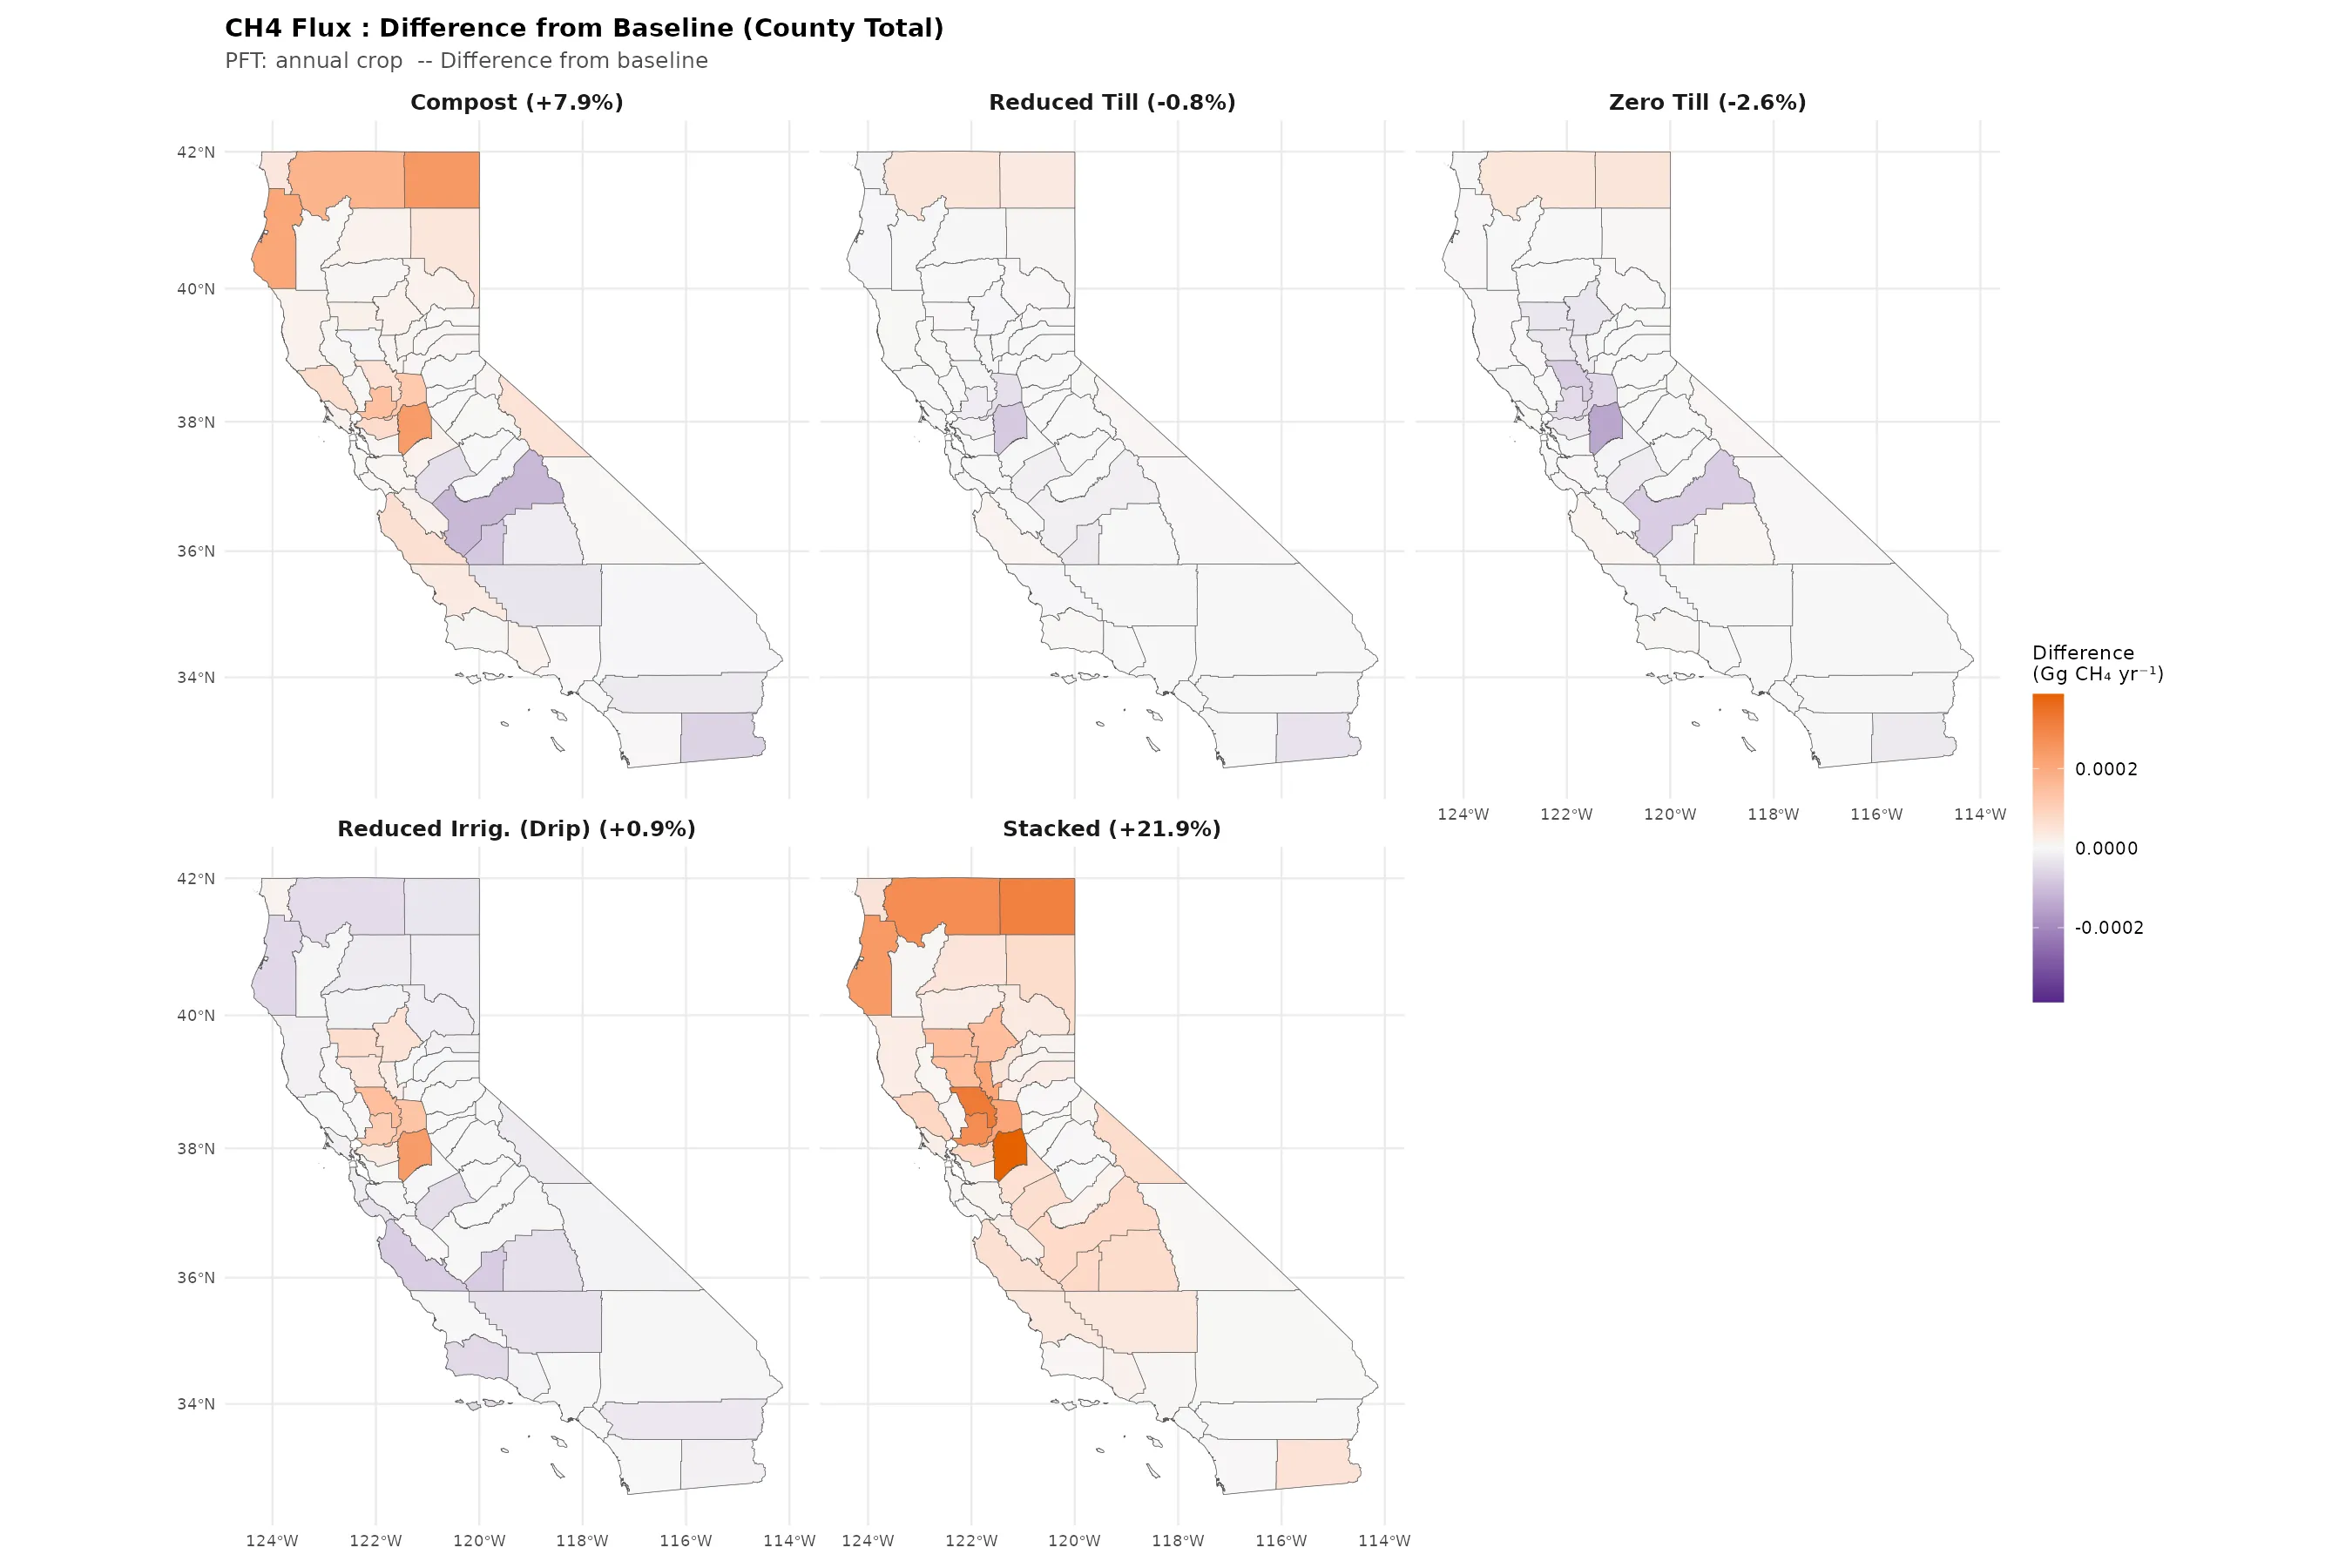
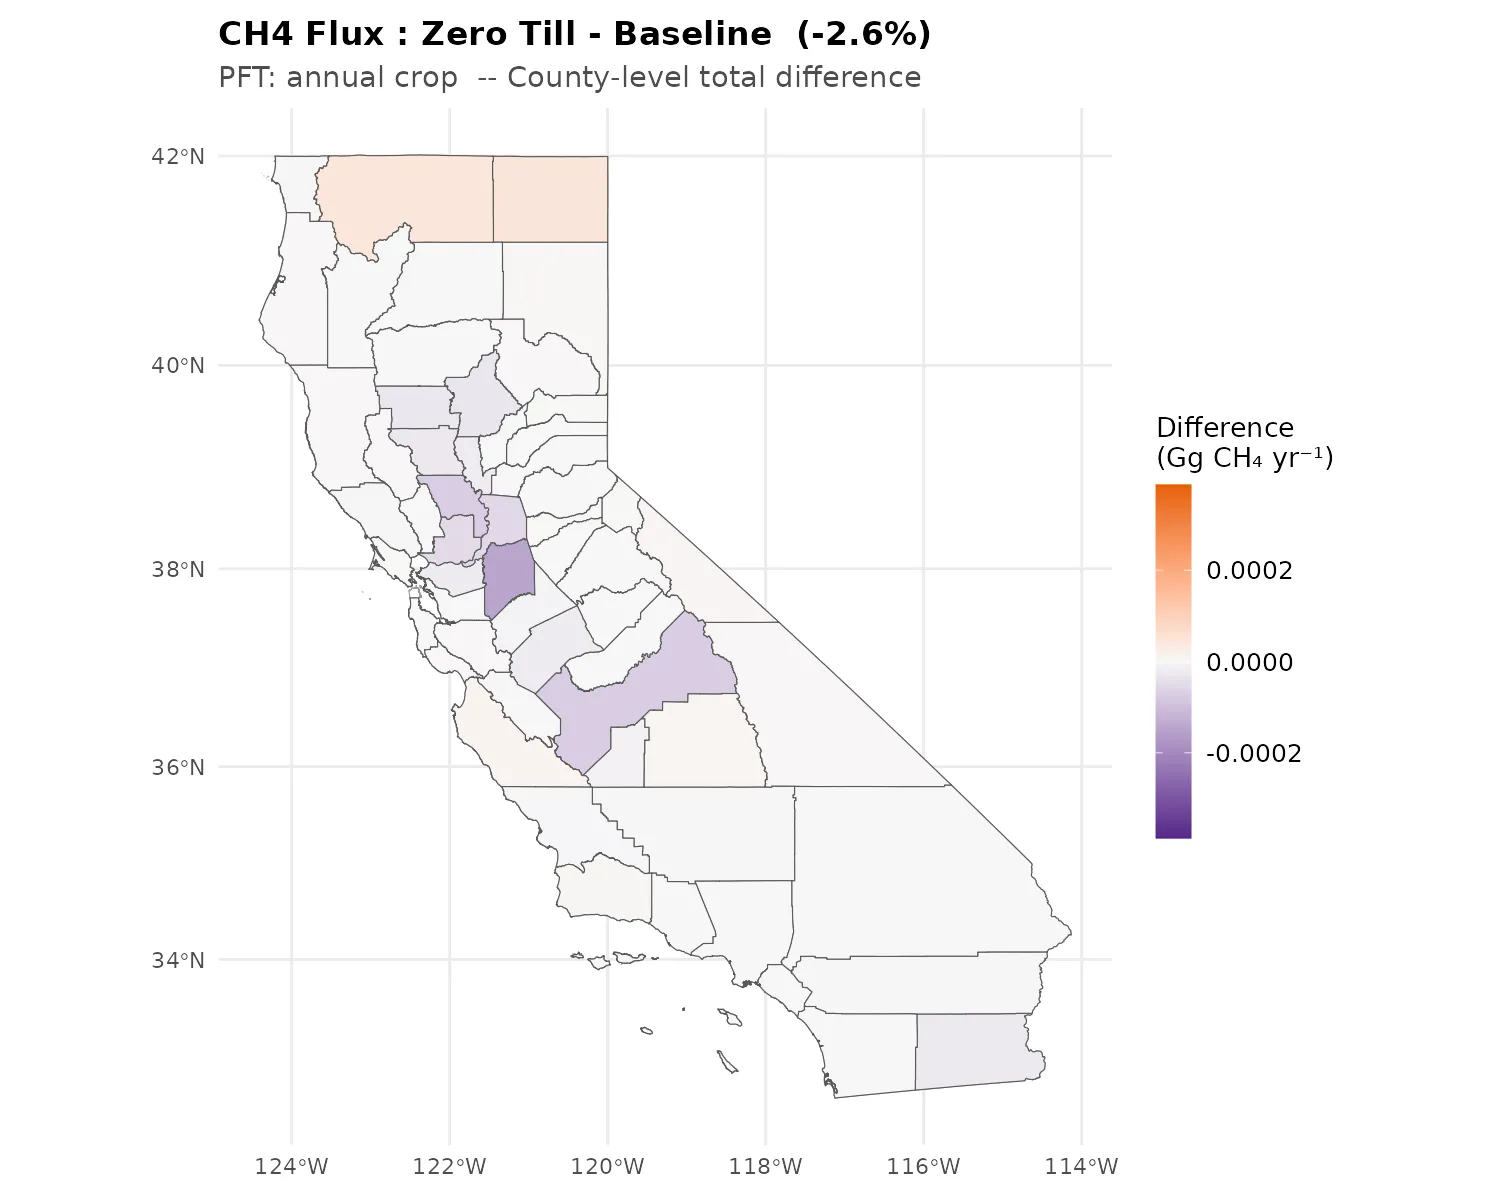
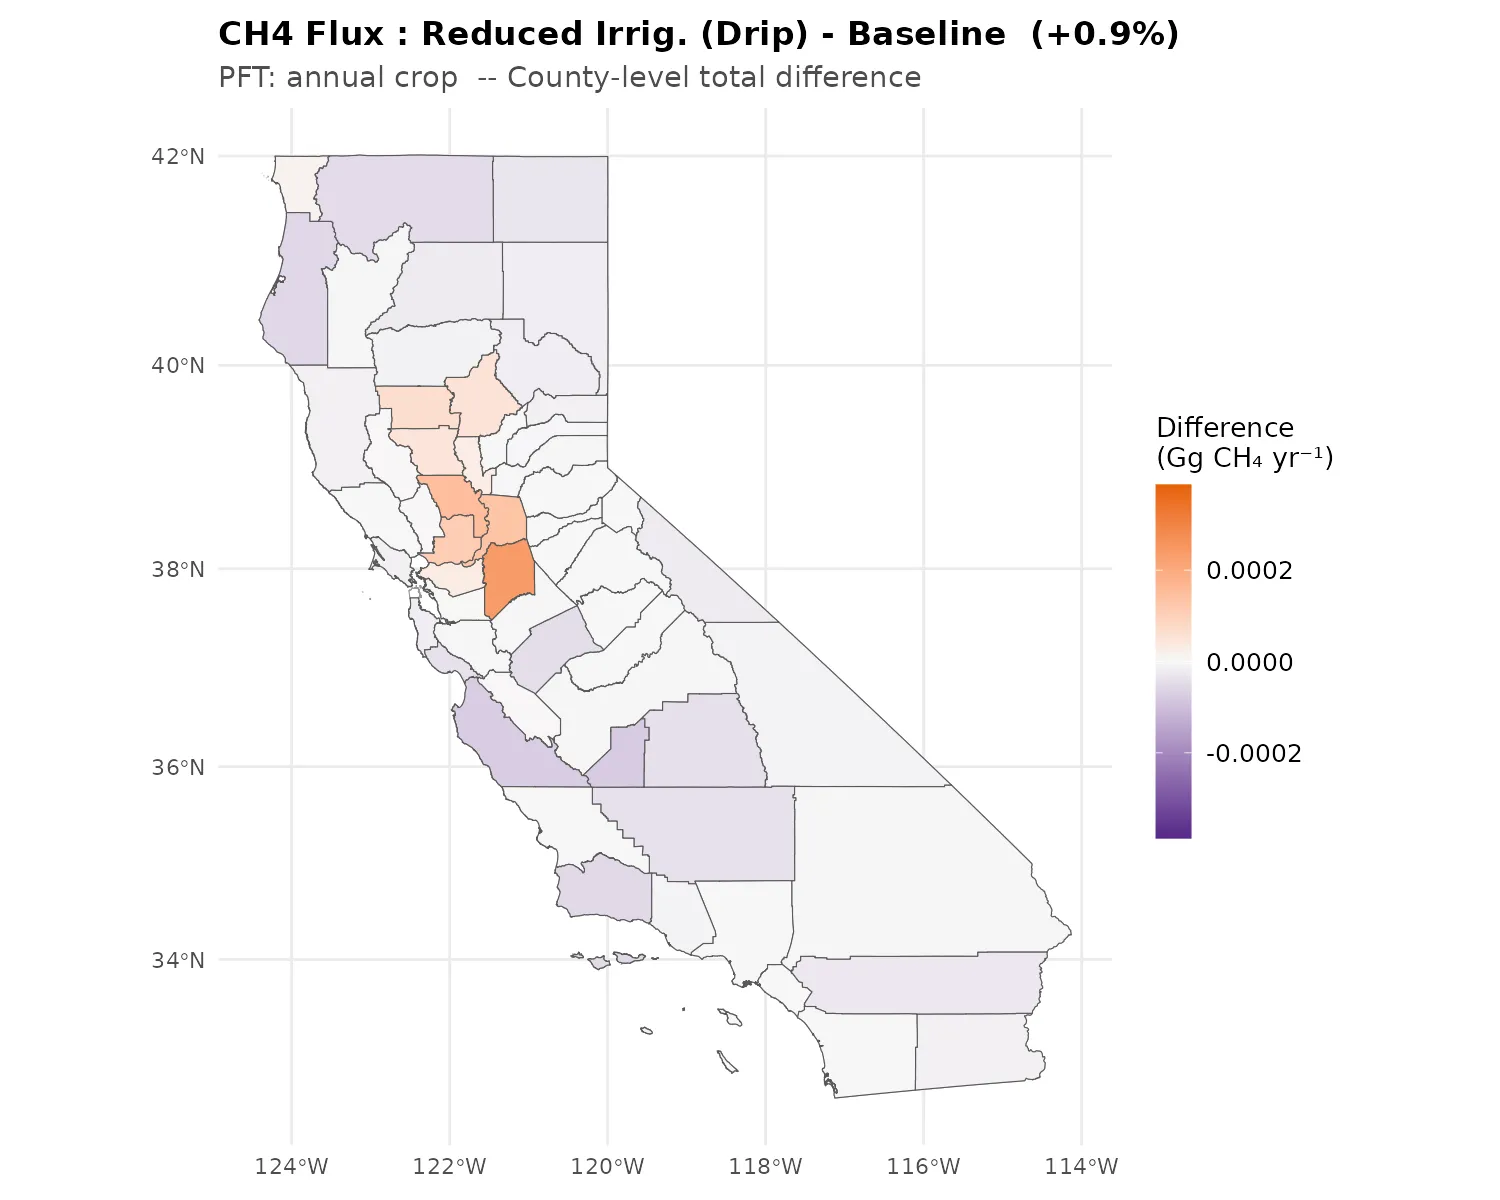
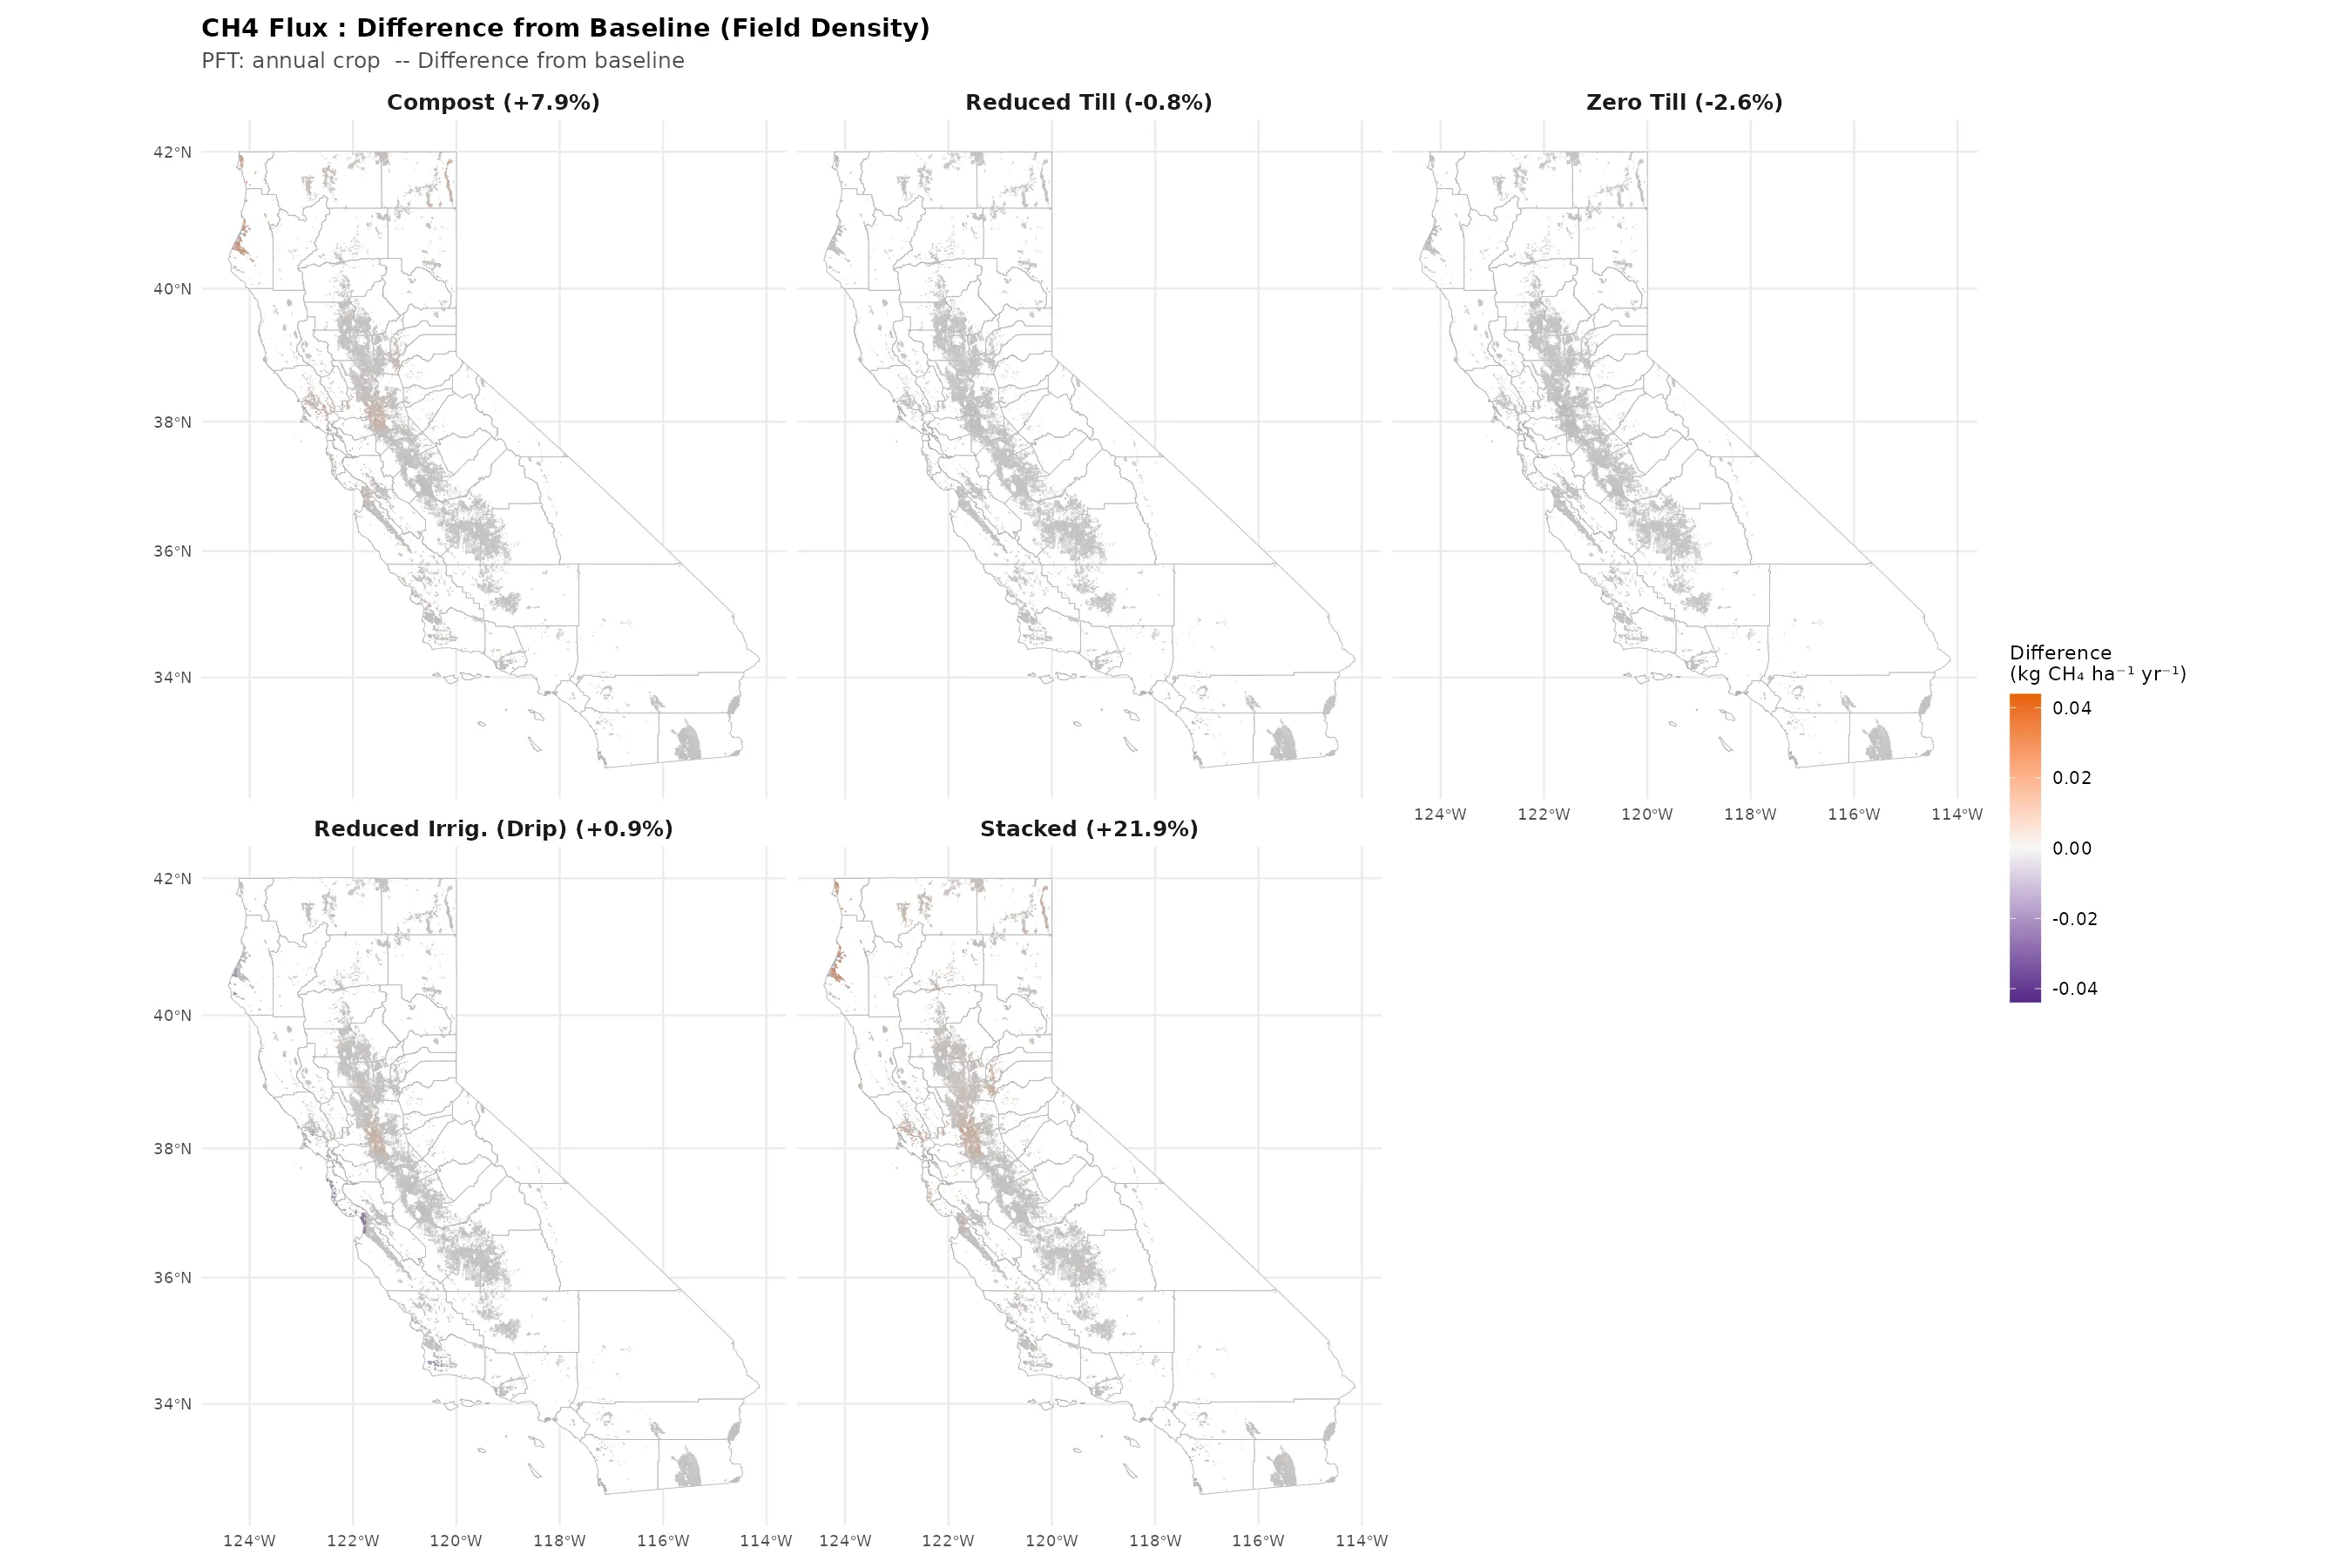
Individual CH4 Difference Maps
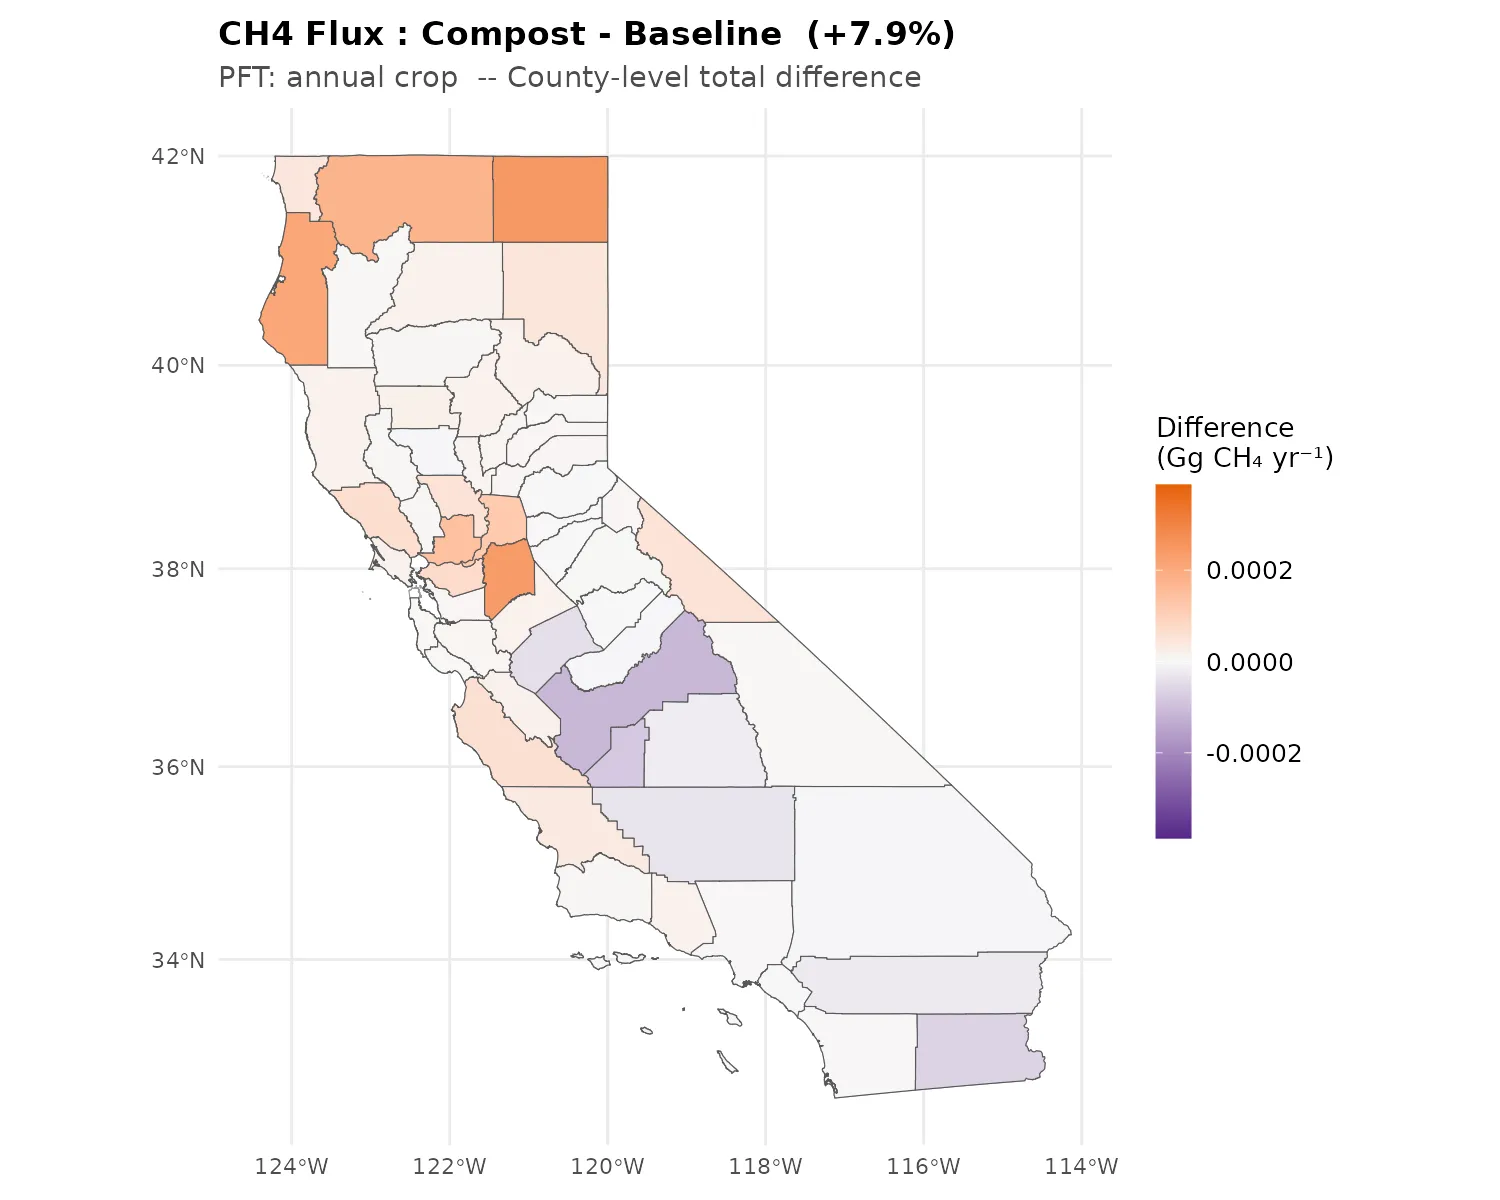
CH4 emissions are effectively zero for both baseline and compost (0.014 vs. 0.015 Gg CH4 yr⁻¹). Any apparent differences are RF noise, not a real signal (see callout above).
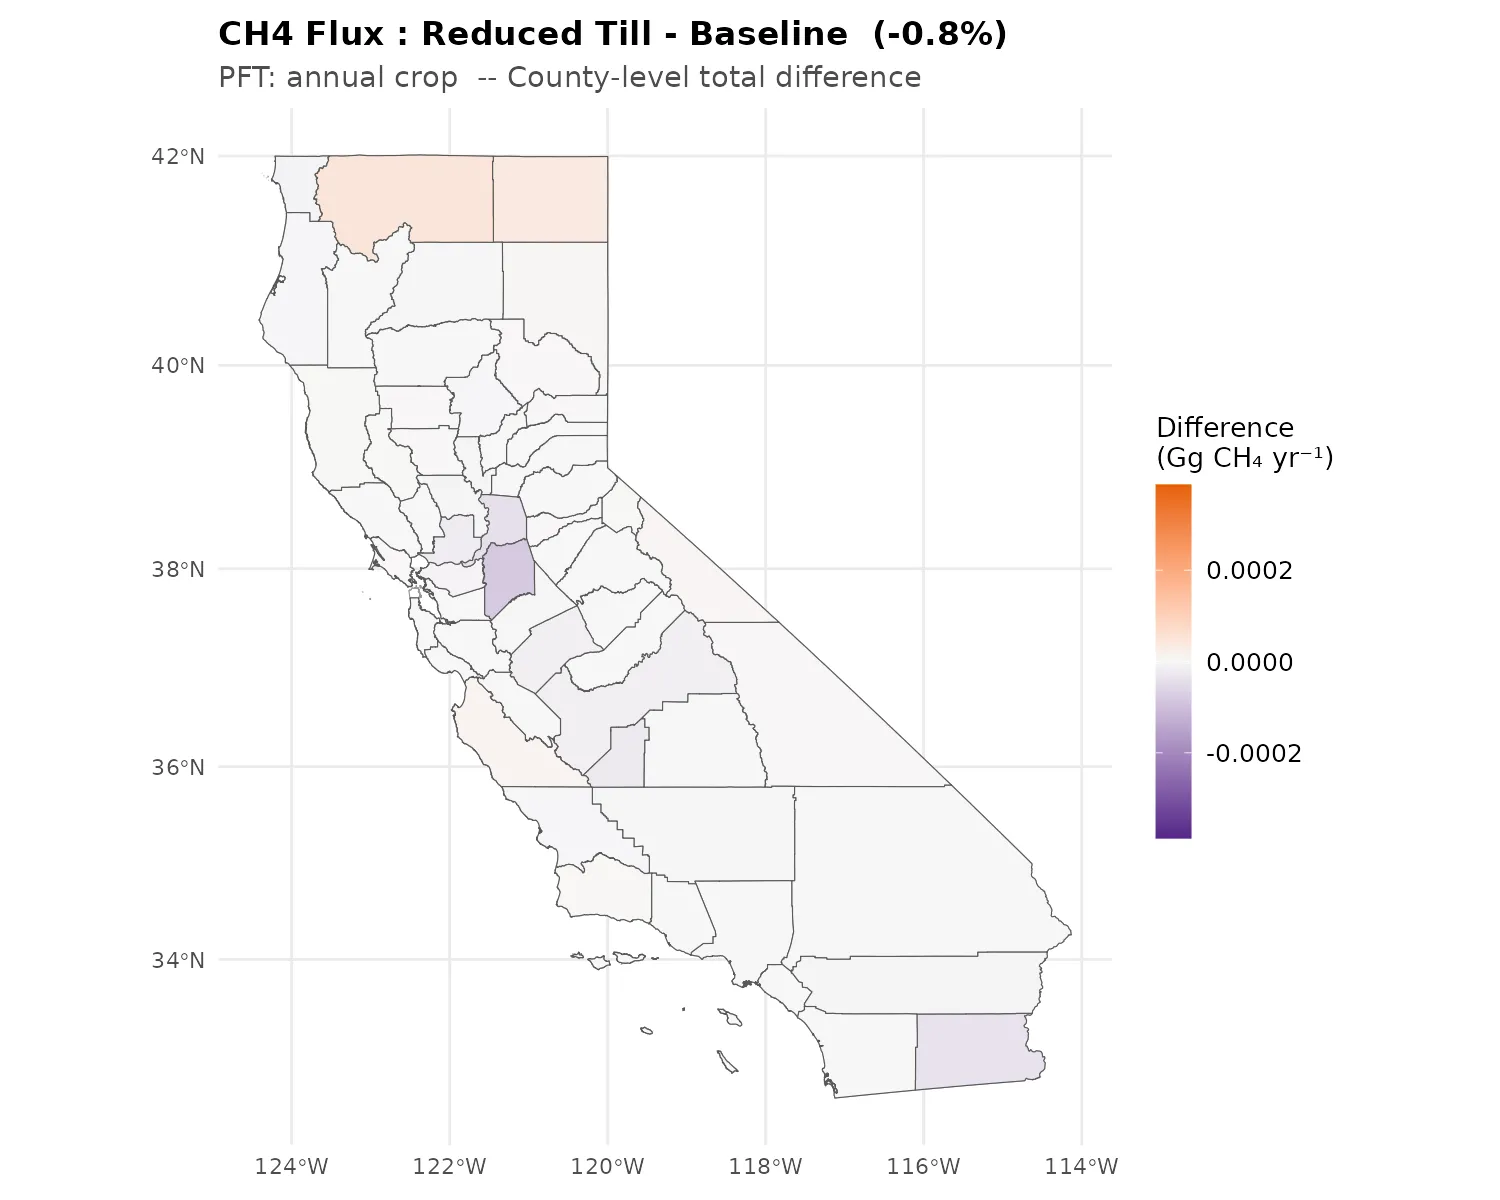
Negligible change from an already near-zero baseline.
Small increase from a near-zero baseline. Not meaningfully different from zero.
Effectively zero, same as baseline. All non-flooded annual crop CH4 values are noise.
Effectively zero, same as all other scenarios. All non-flooded annual crop CH4 values are noise from the RF model fitting to near-zero training data.
Field-Level CH4
GHG Trade-off Summary
A practice’s net climate benefit depends on the magnitude of soil carbon gains versus GHG emission changes, expressed in common units (CO2e). The CO2e Summary Table on the overview page quantifies these trade-offs using GWP100 AR4 values (CH4 = 25, N2O = 298; IPCC 2007, WG1 Table 2.14).
Key findings in CO2e terms (Gg CO2e yr⁻¹ vs baseline):
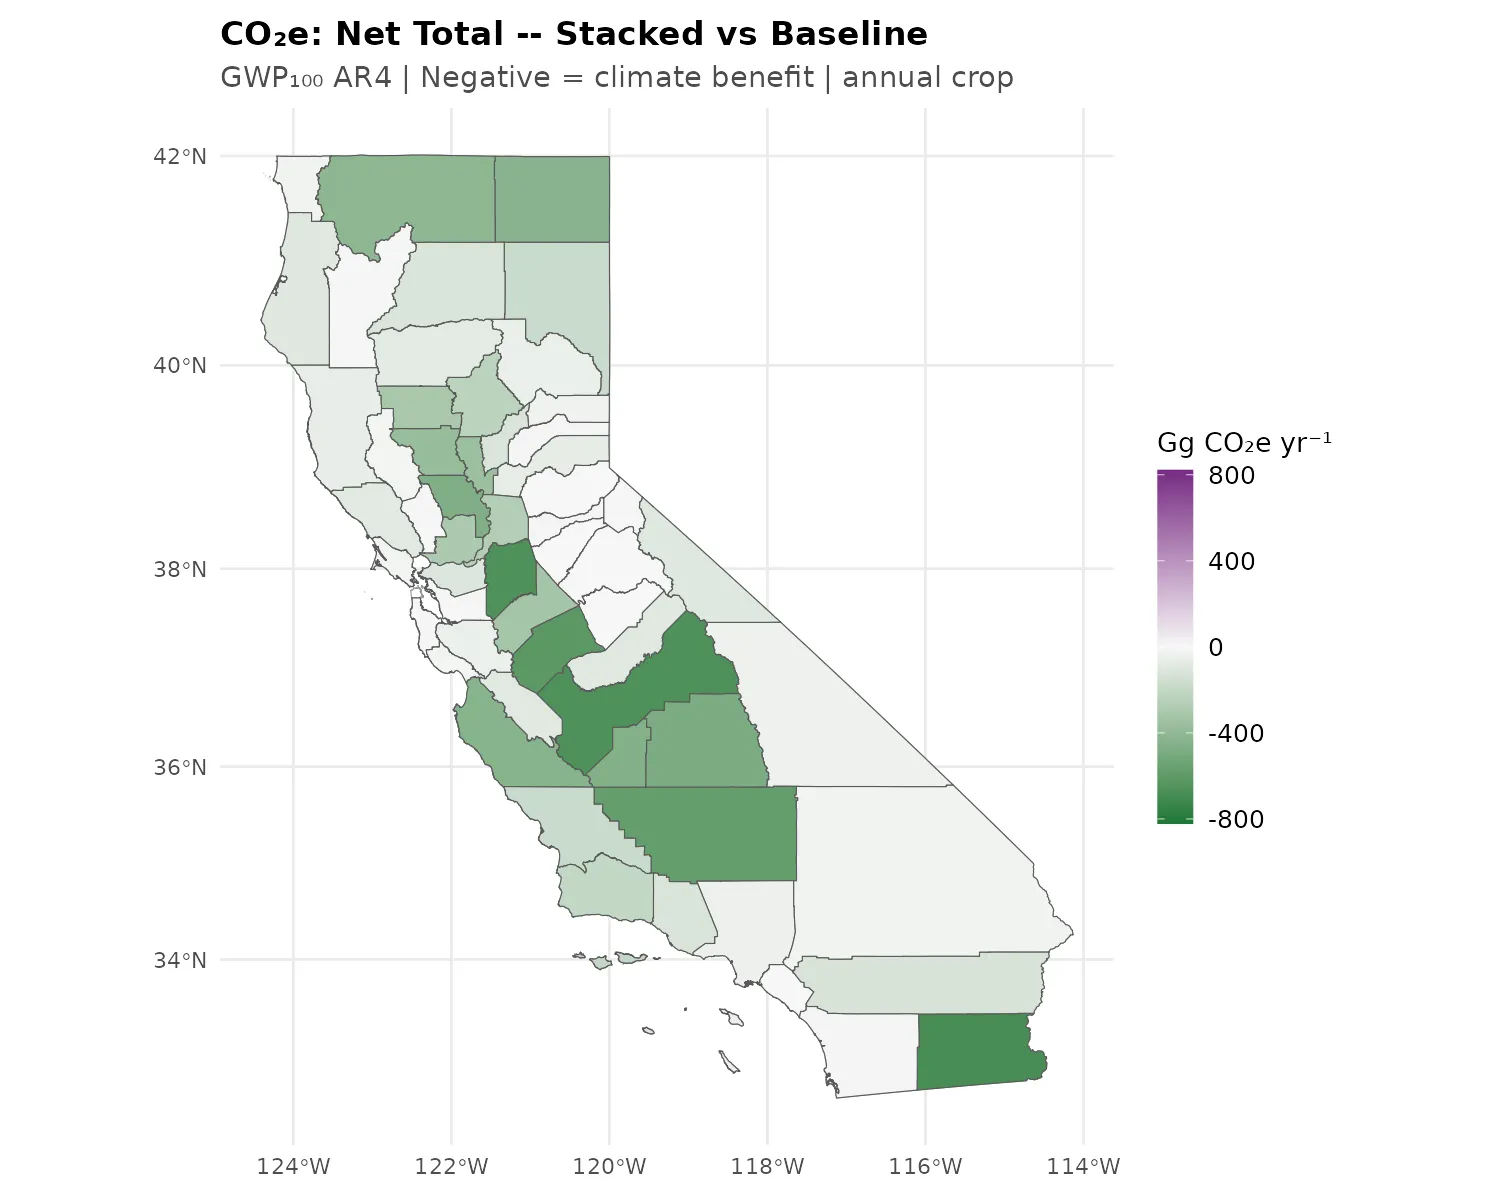
- Stacked: Largest net benefit (-9,613). SOC sequestration (-8,563) and N2O reduction (-1,050) both contribute strongly.
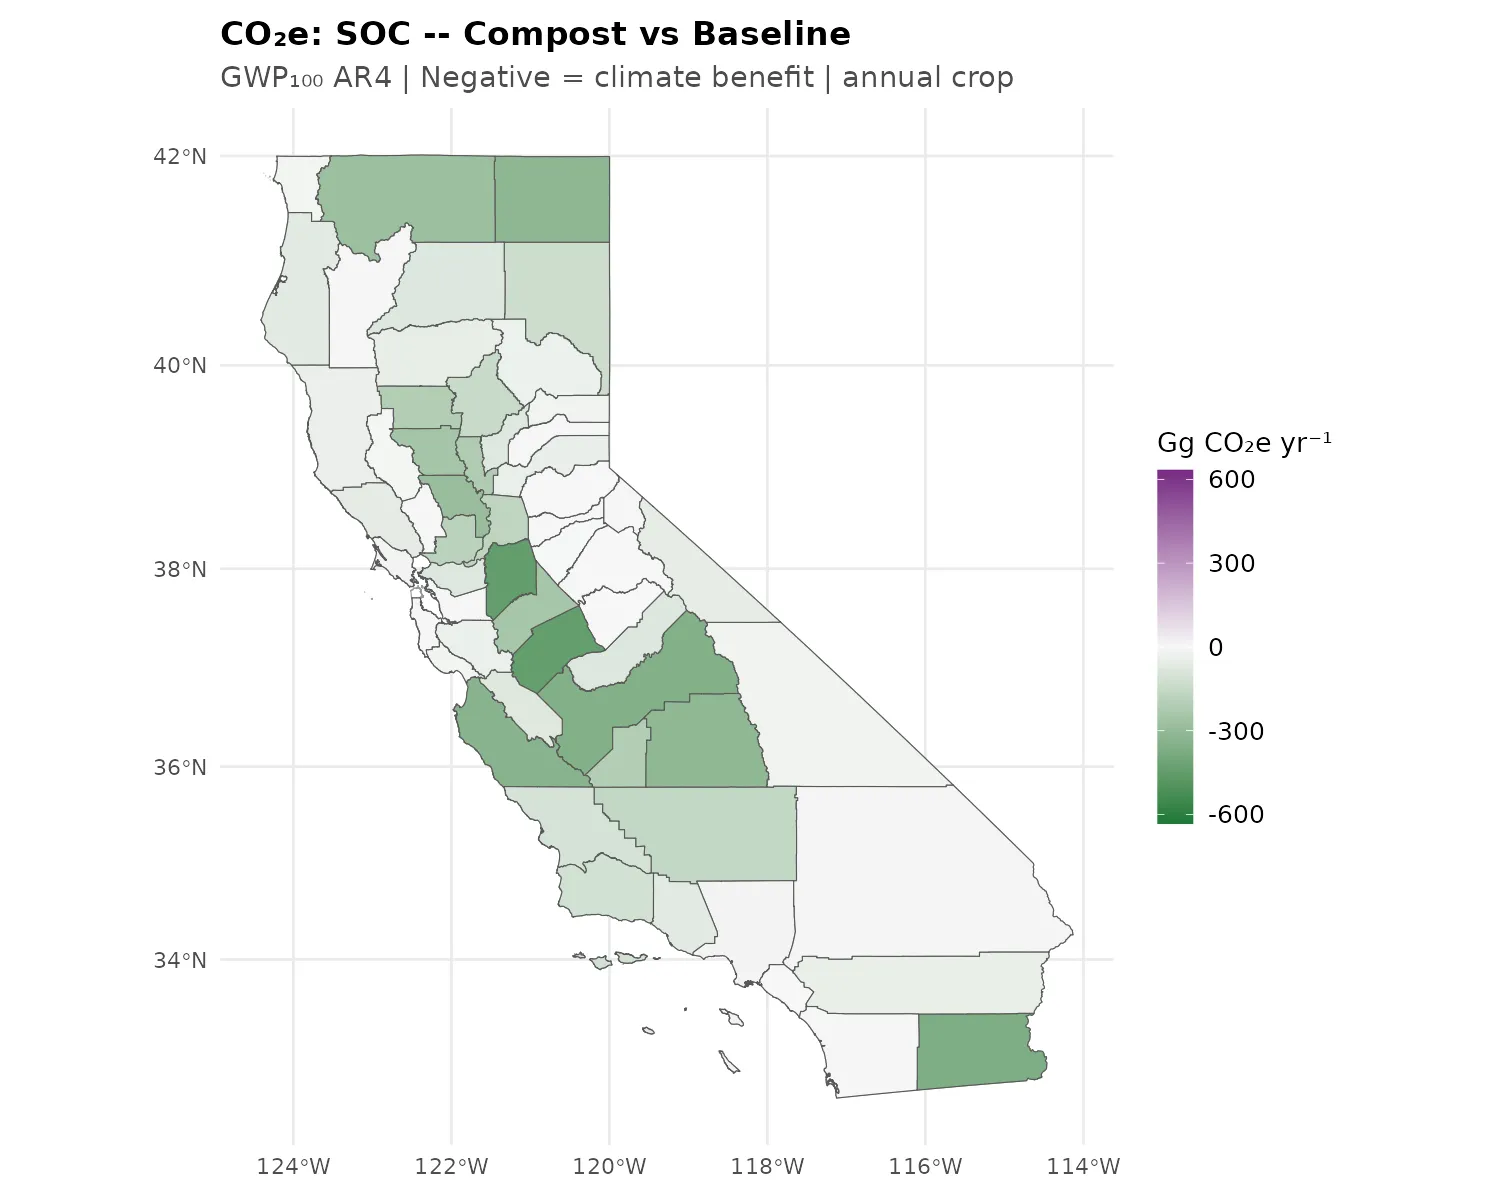
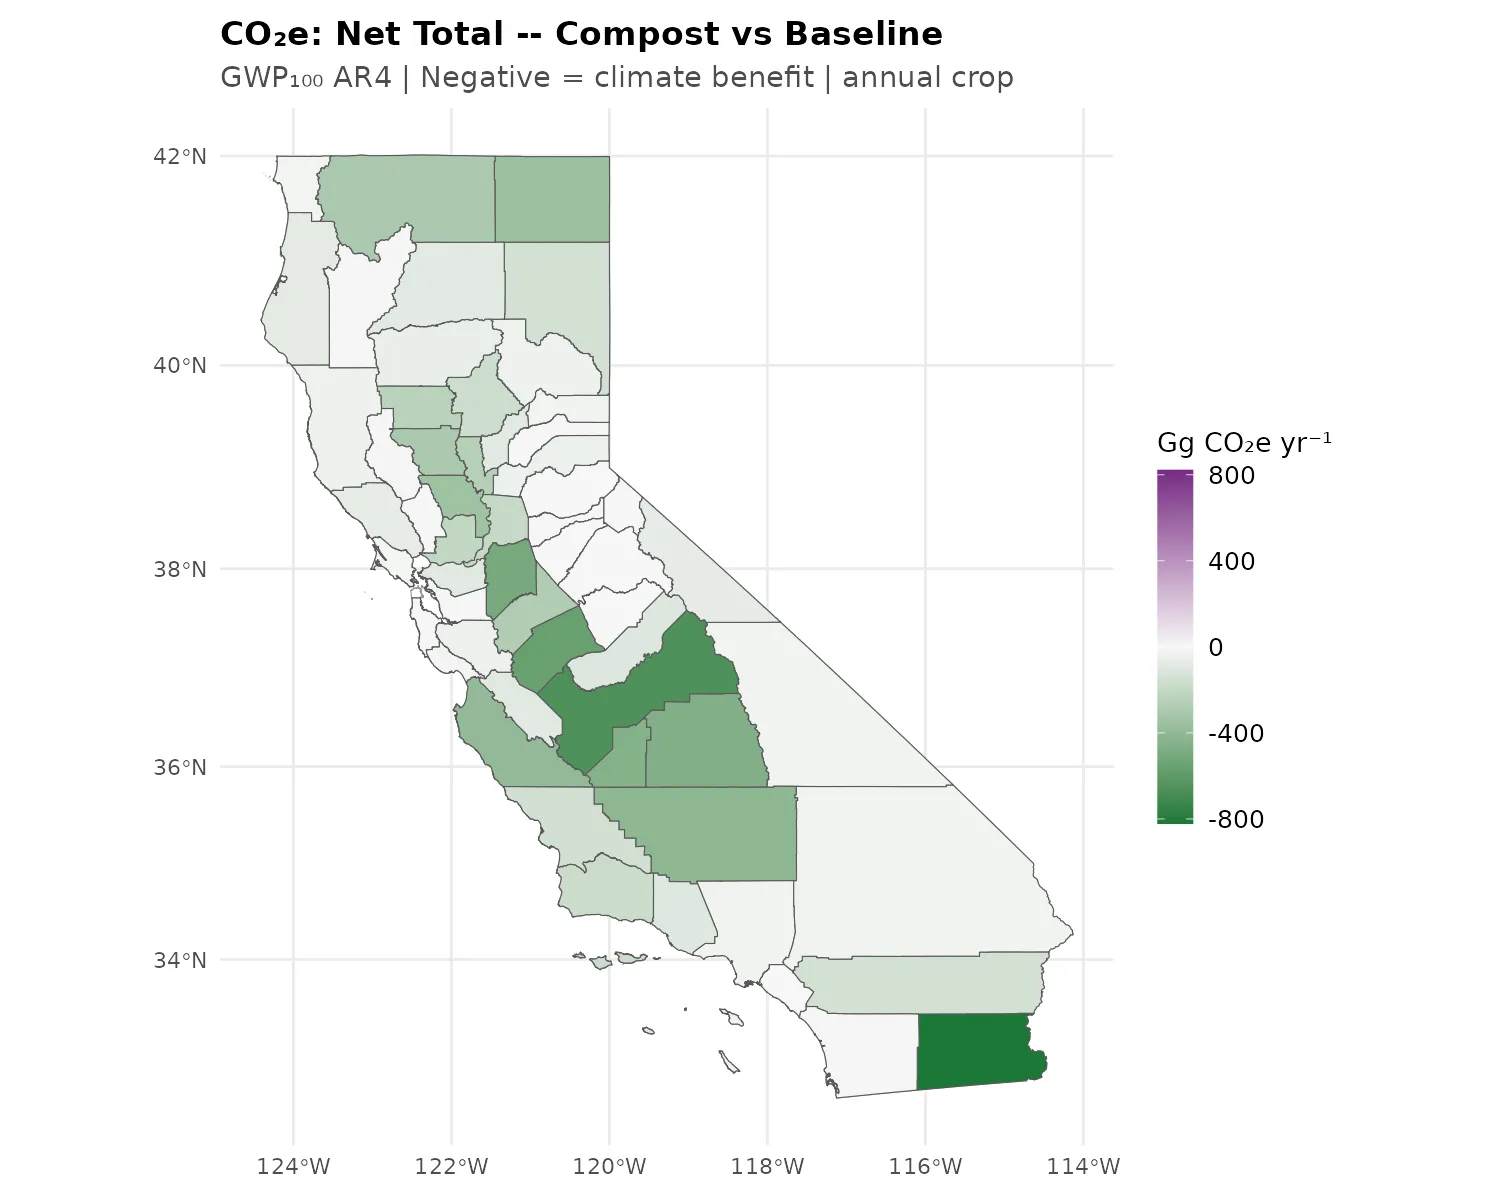
- Compost: Second-largest net benefit (-7,777). SOC sequestration (-6,256) and N2O reduction (-1,521) dominate.
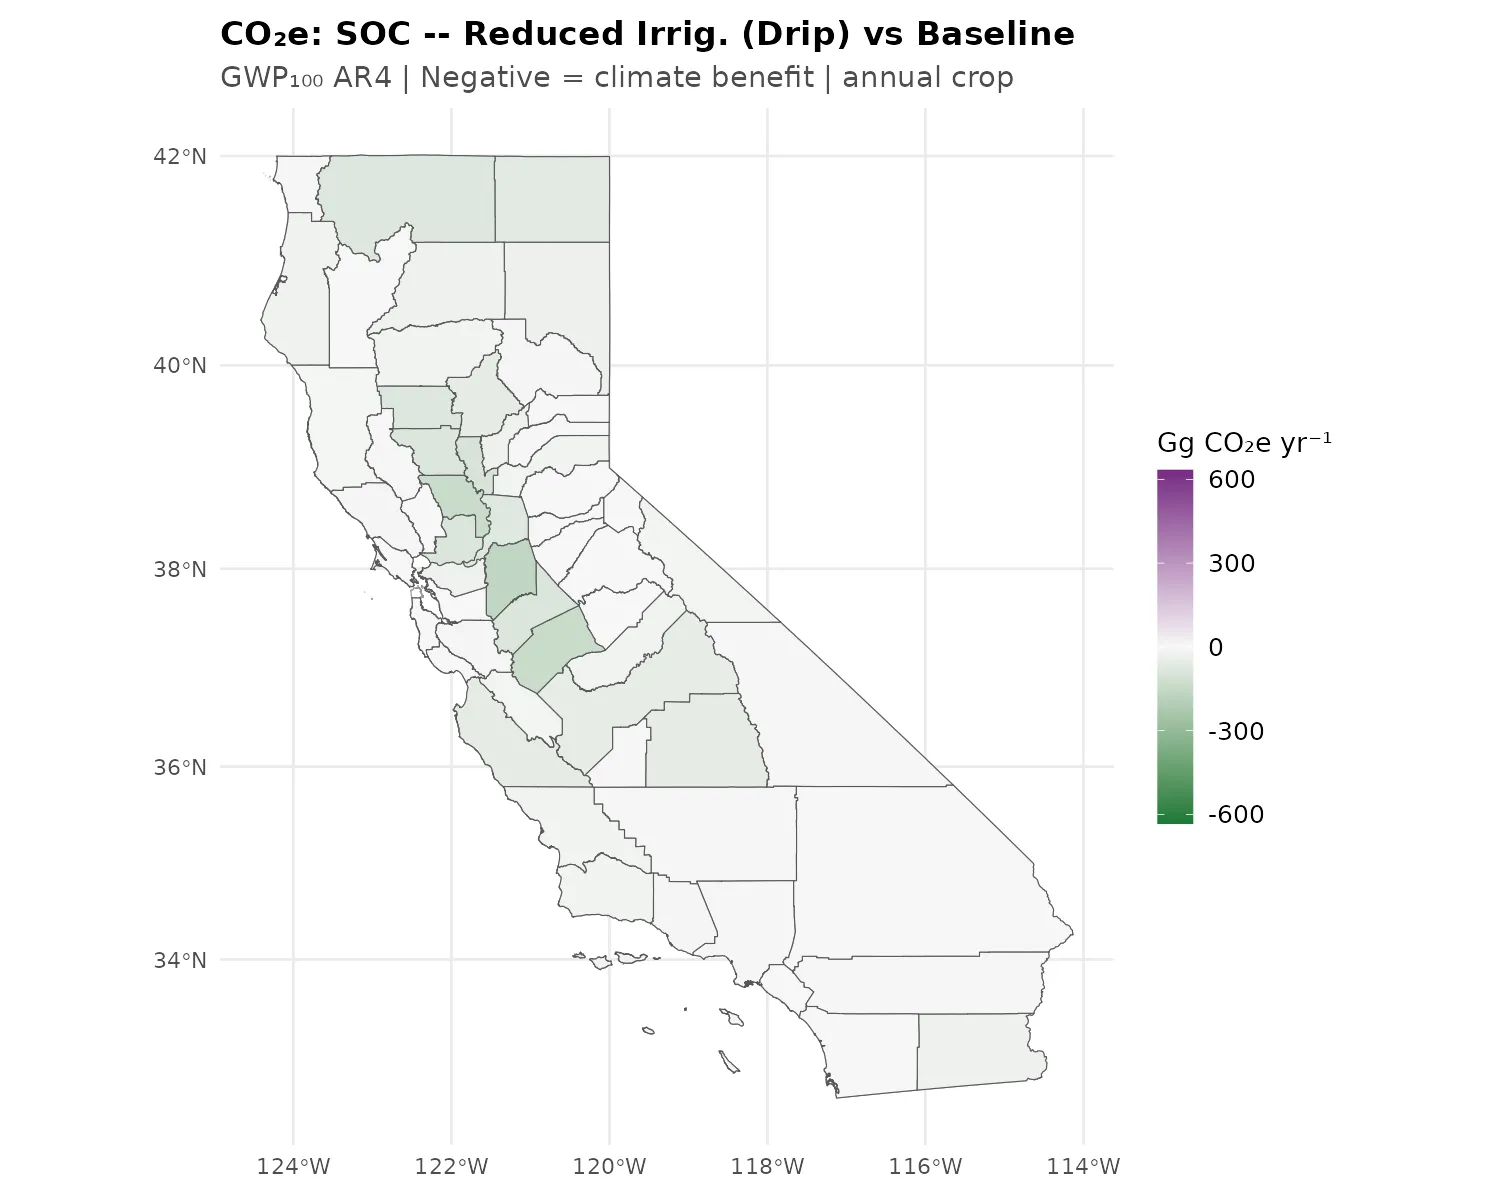
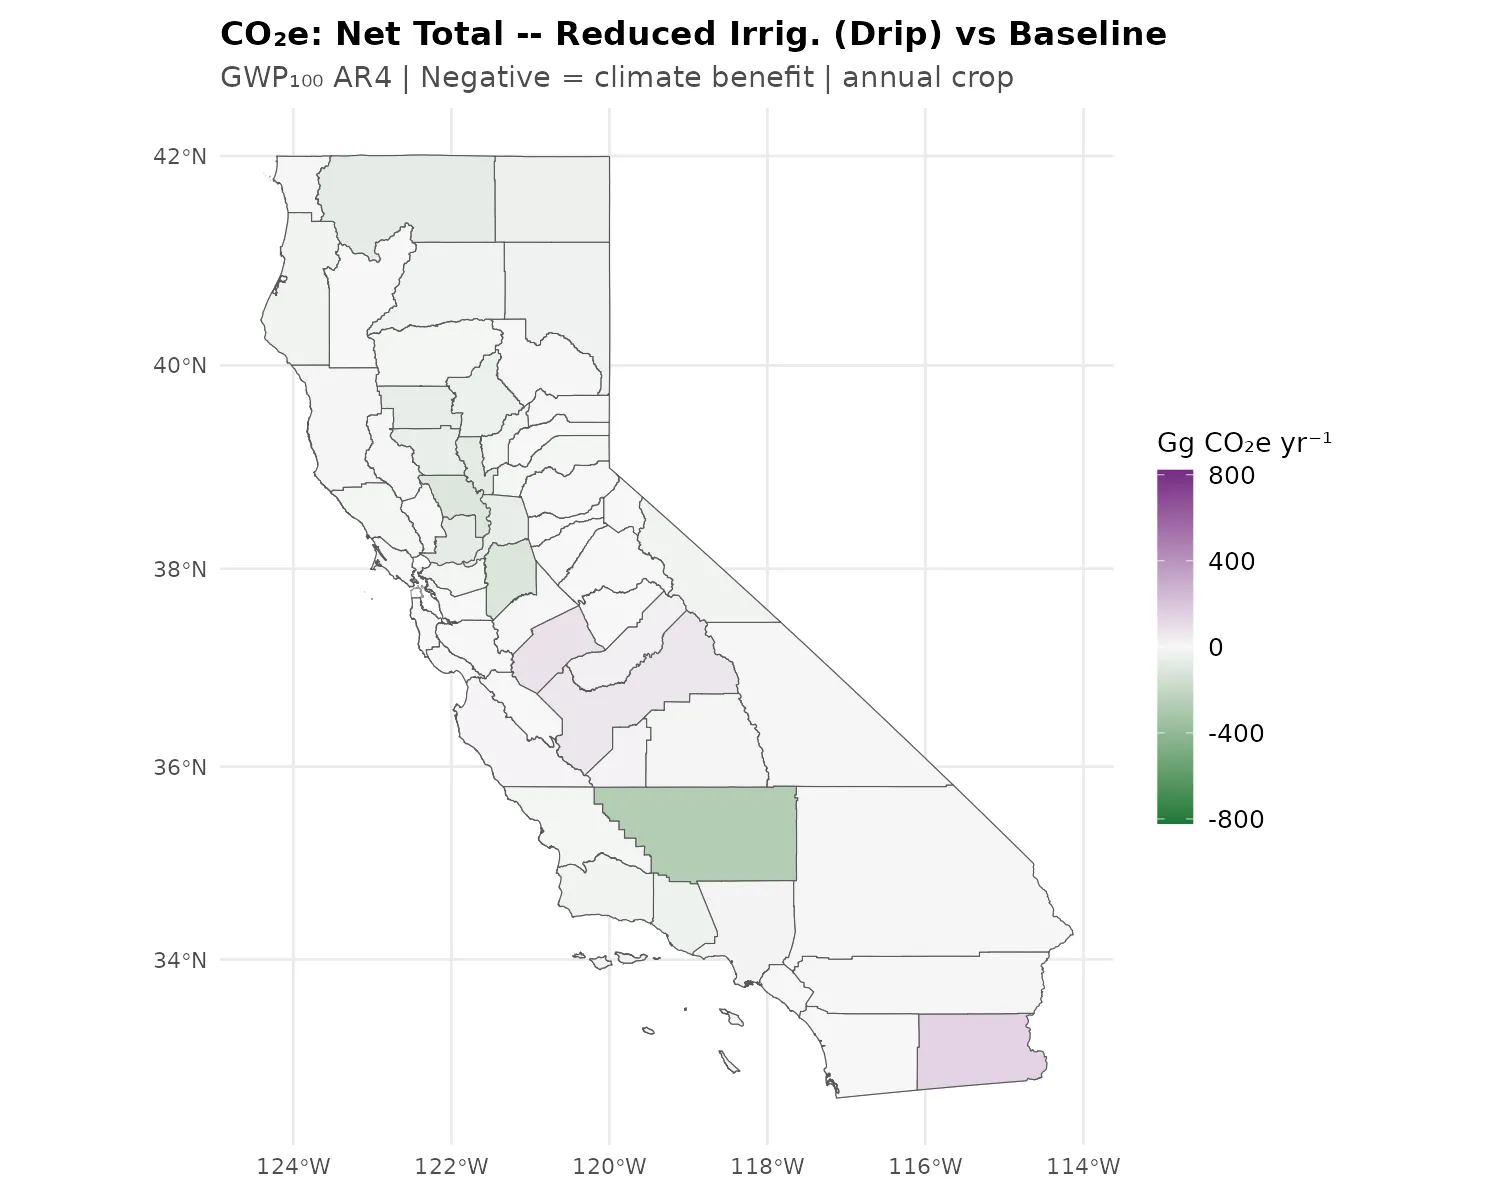
- Drip irrigation: Moderate net benefit (-1,215). SOC gain (-1,675) offsets N2O increase (+460).
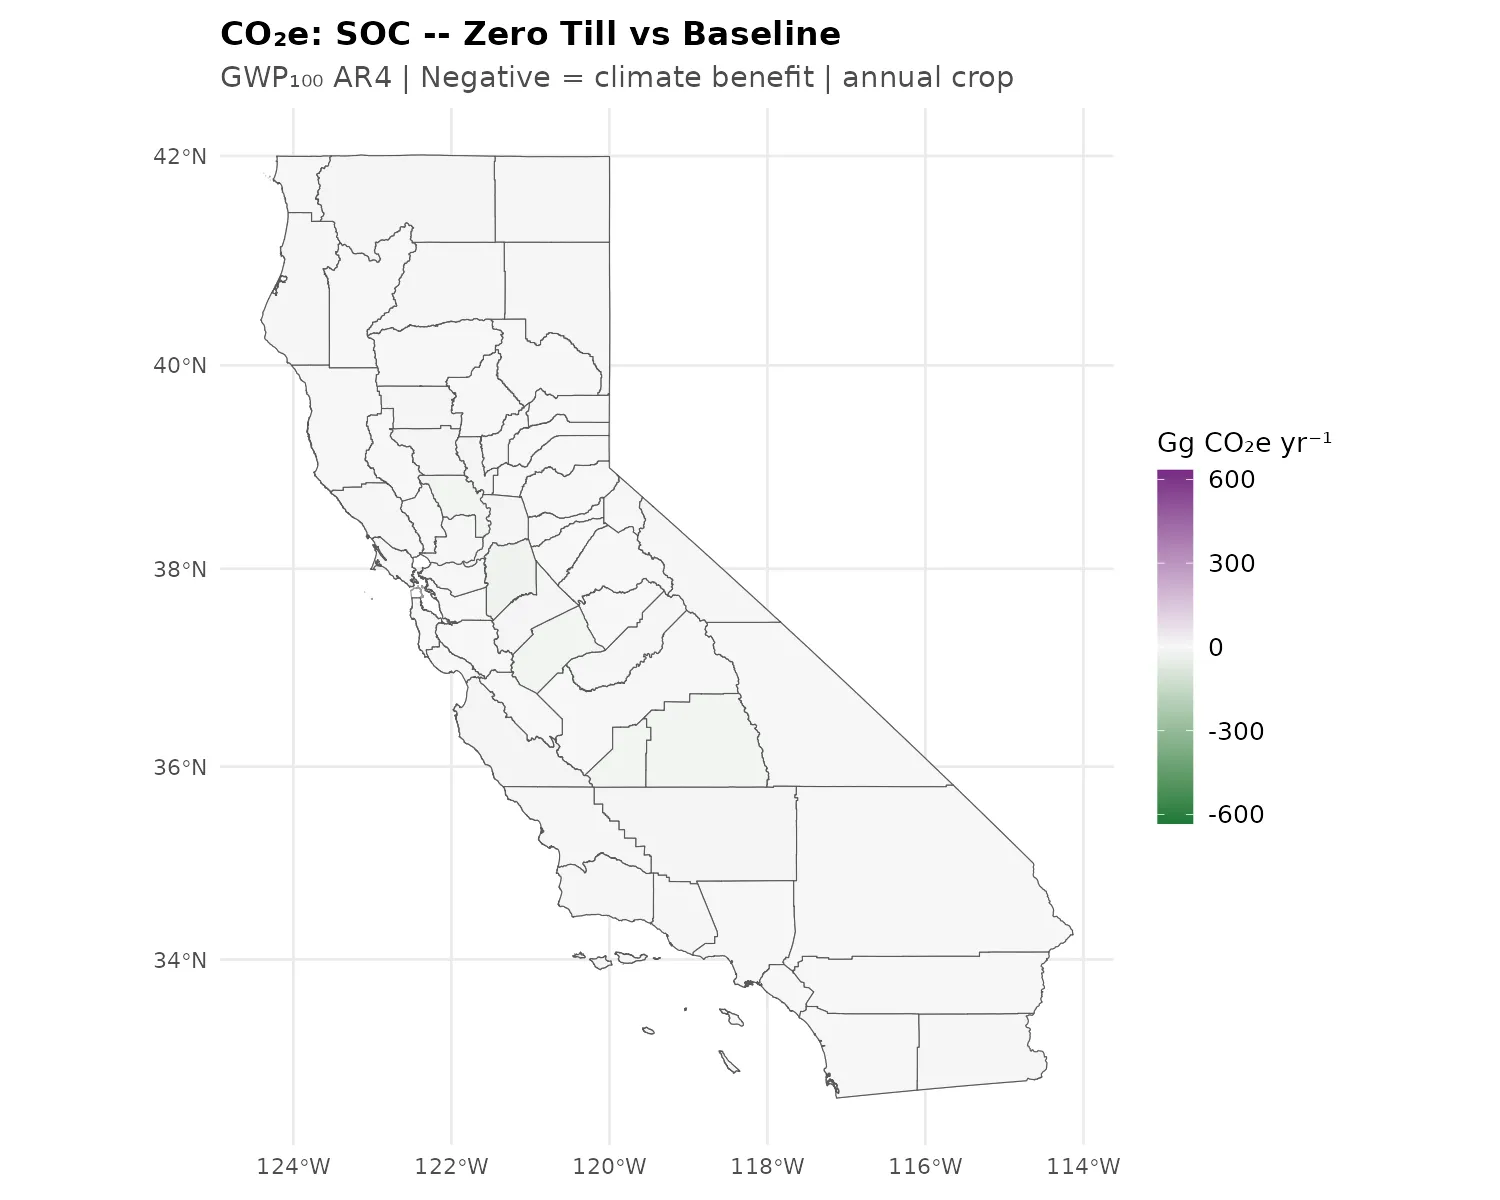
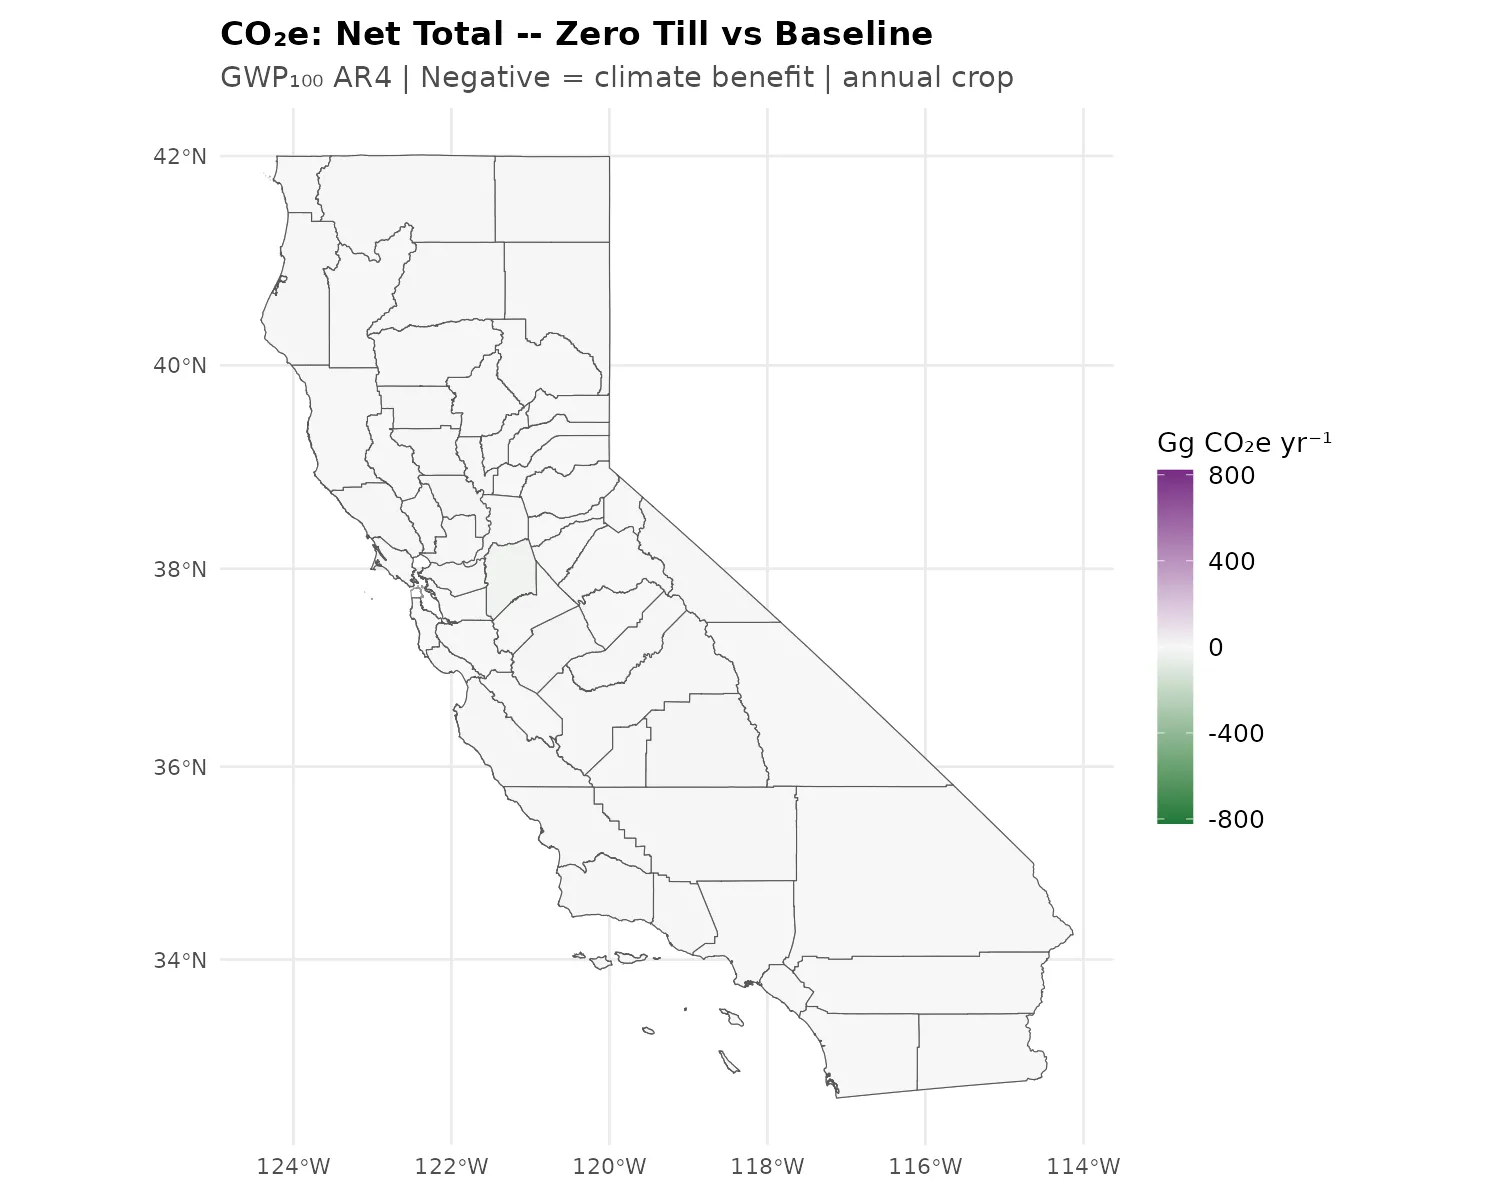
- Zero till: Small net benefit (-191). SOC gain (-211) slightly offset by negligible N2O increase (+21).
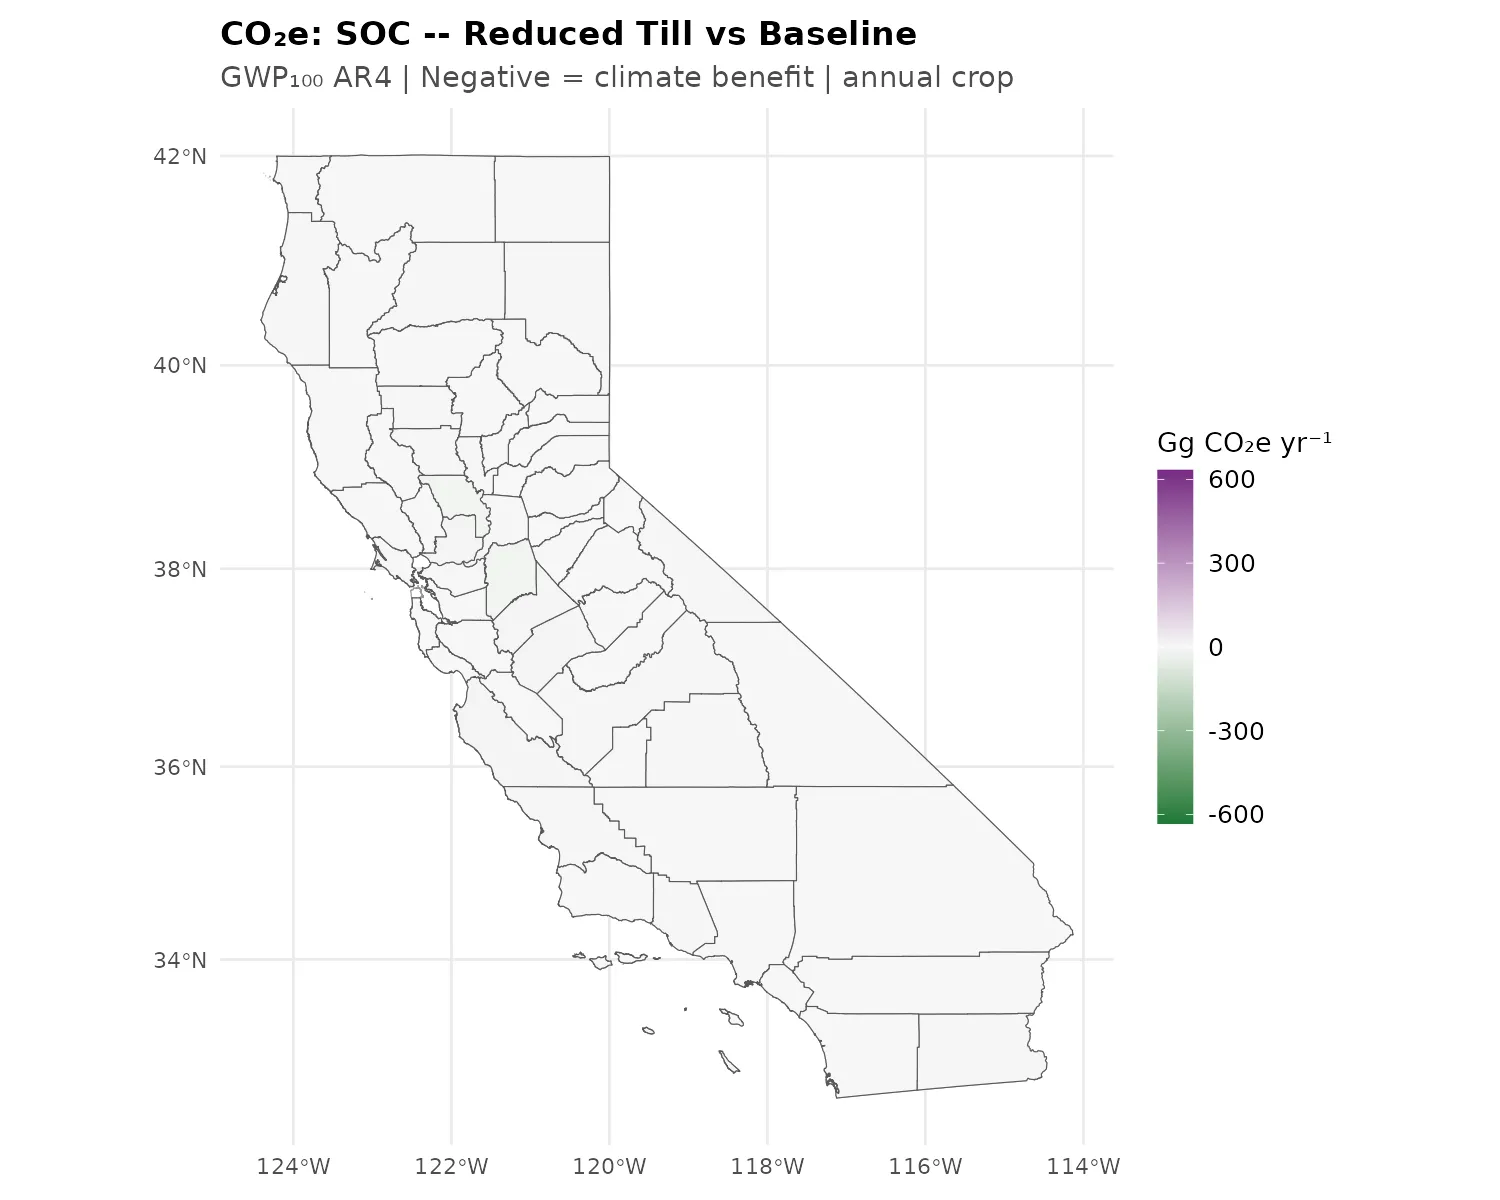
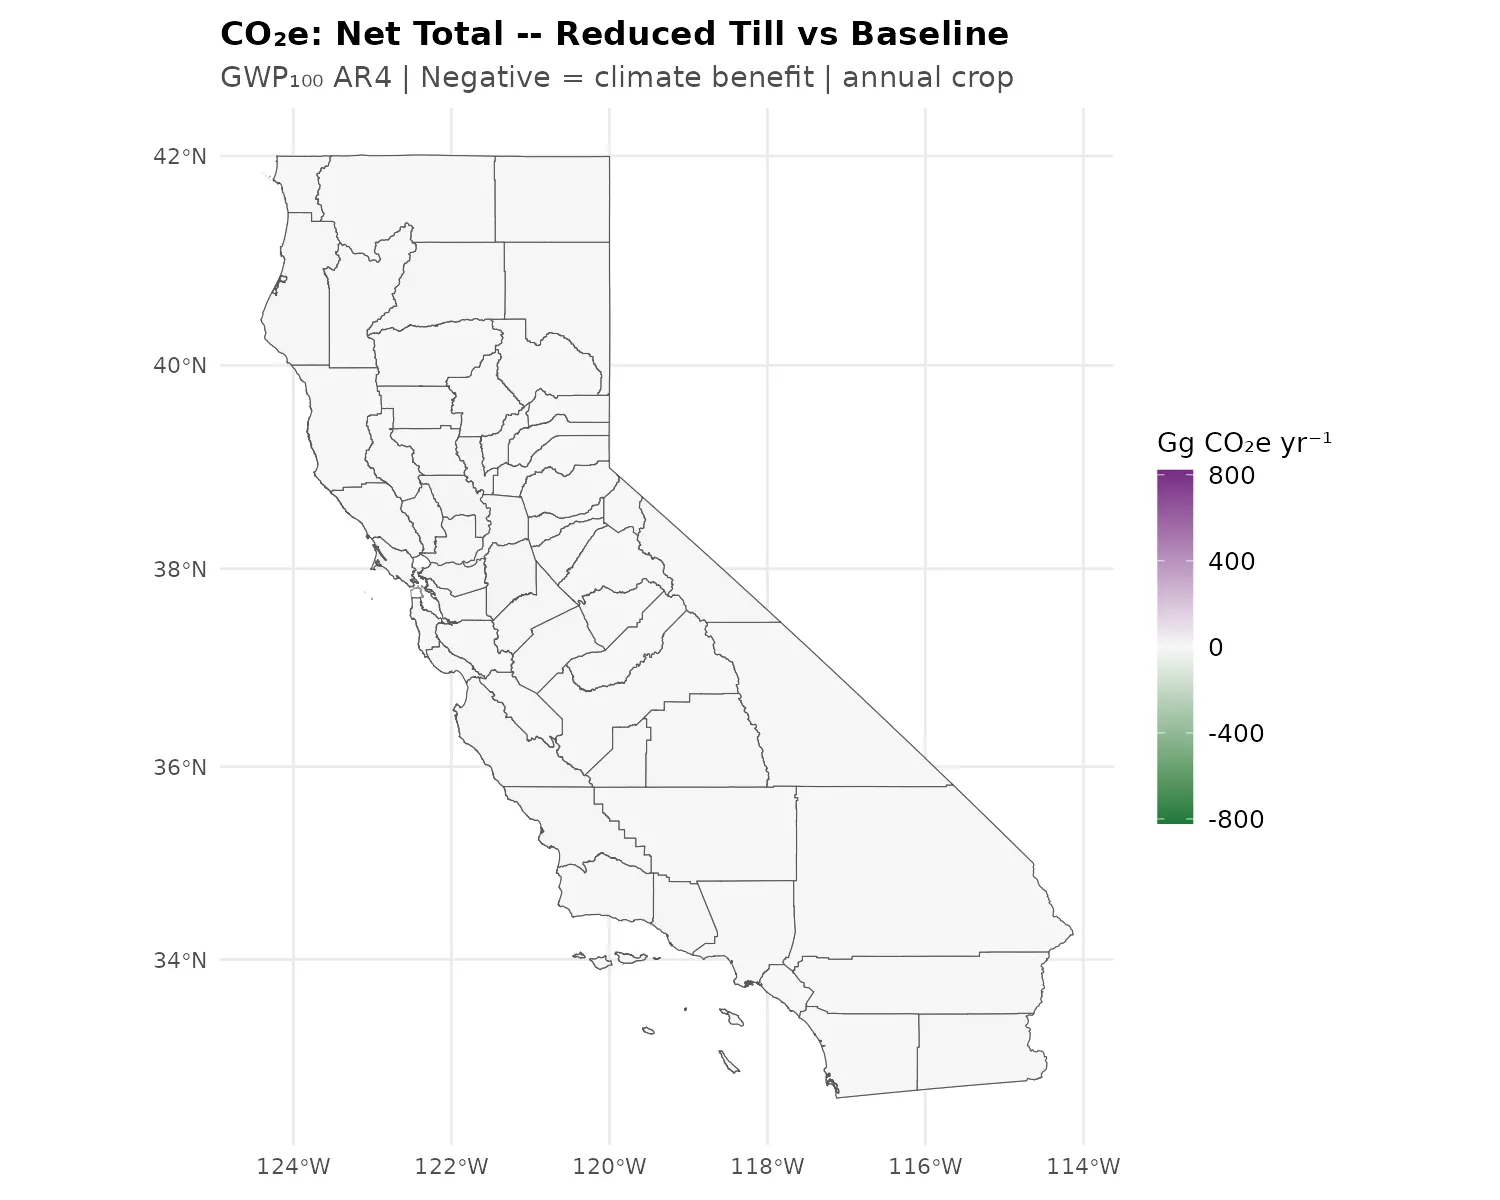
- Reduced till: Small net benefit (-115). SOC gain (-119) with negligible N2O change (+3).
All five management scenarios show net climate benefits relative to baseline. The tillage scenarios produce the smallest benefits, consistent with the modest SOC gains over 8 years. These CO2e estimates represent the maximum technical potential assuming simultaneous adoption across all 1.86 million hectares. SOC accumulation rates typically decline as soils approach a new equilibrium, so extrapolation beyond the 8-year simulation period would overestimate long-term mitigation. CH4 contributes approximately 0% of the net CO2e in every scenario; meaningful CH4 contributions are expected when rice paddies are included in future model runs.
These trade-offs underscore the importance of reporting both soil carbon and non-CO2 greenhouse gases when evaluating management practices.
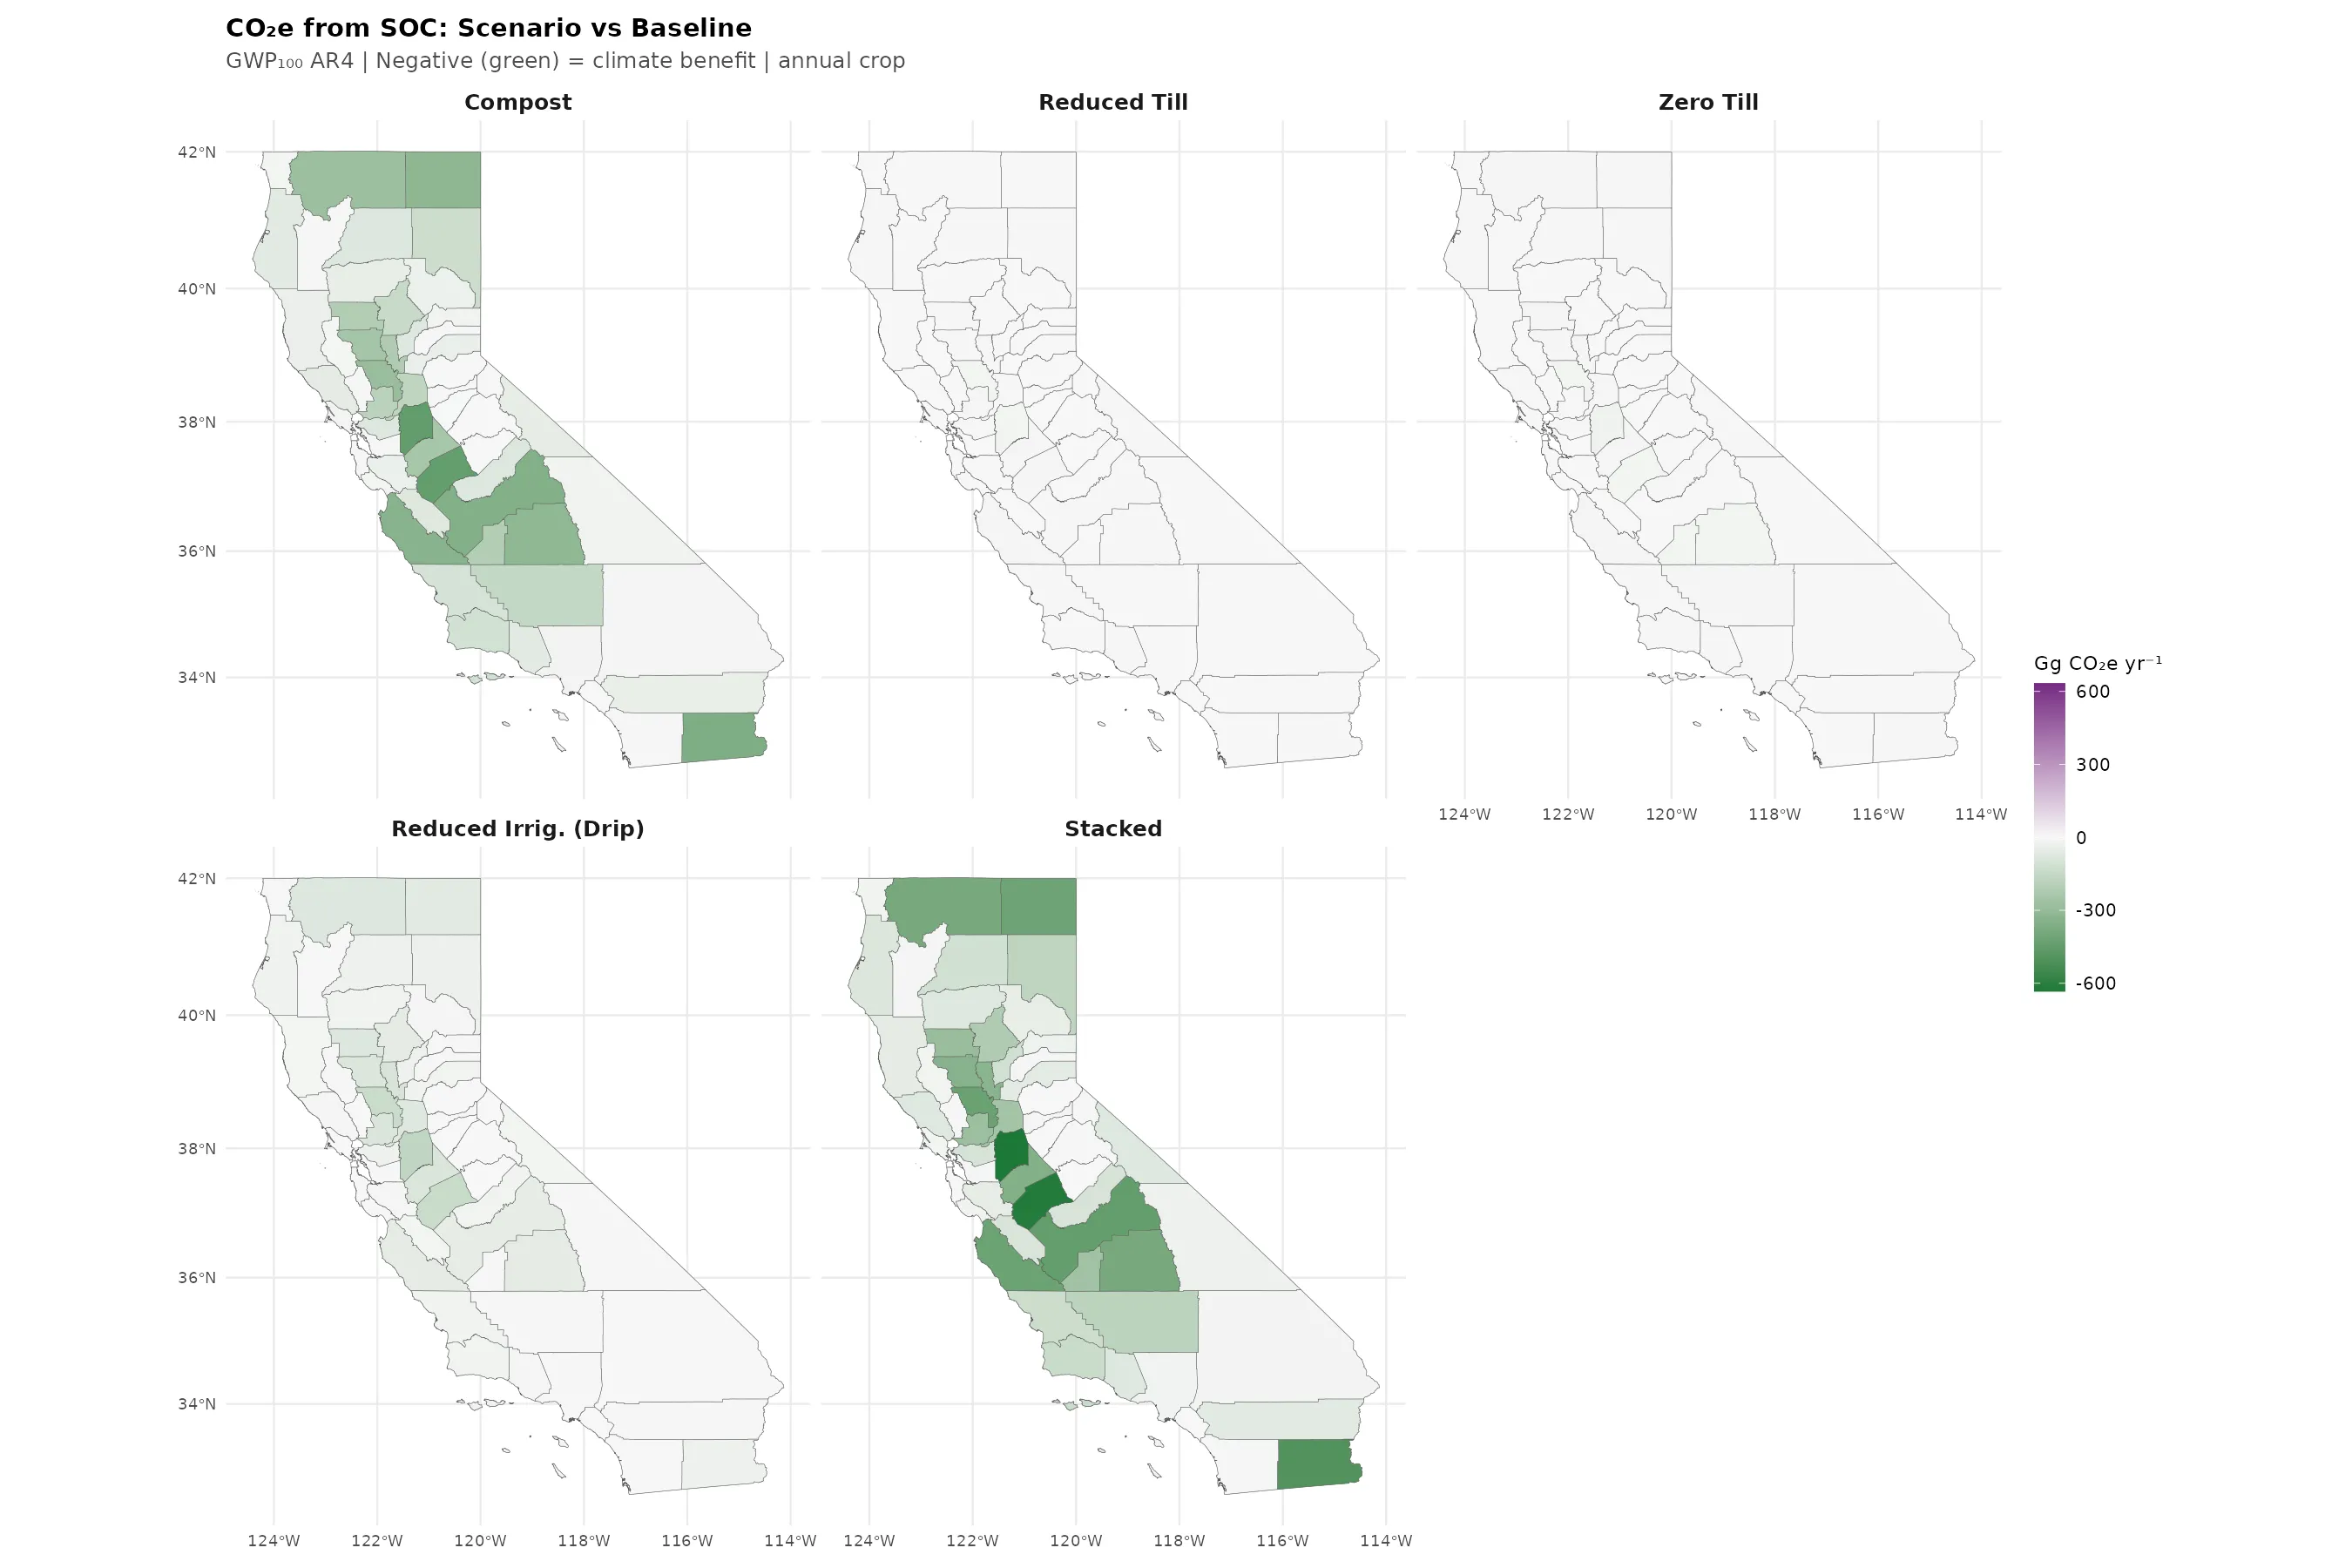
County-Level CO2e Maps
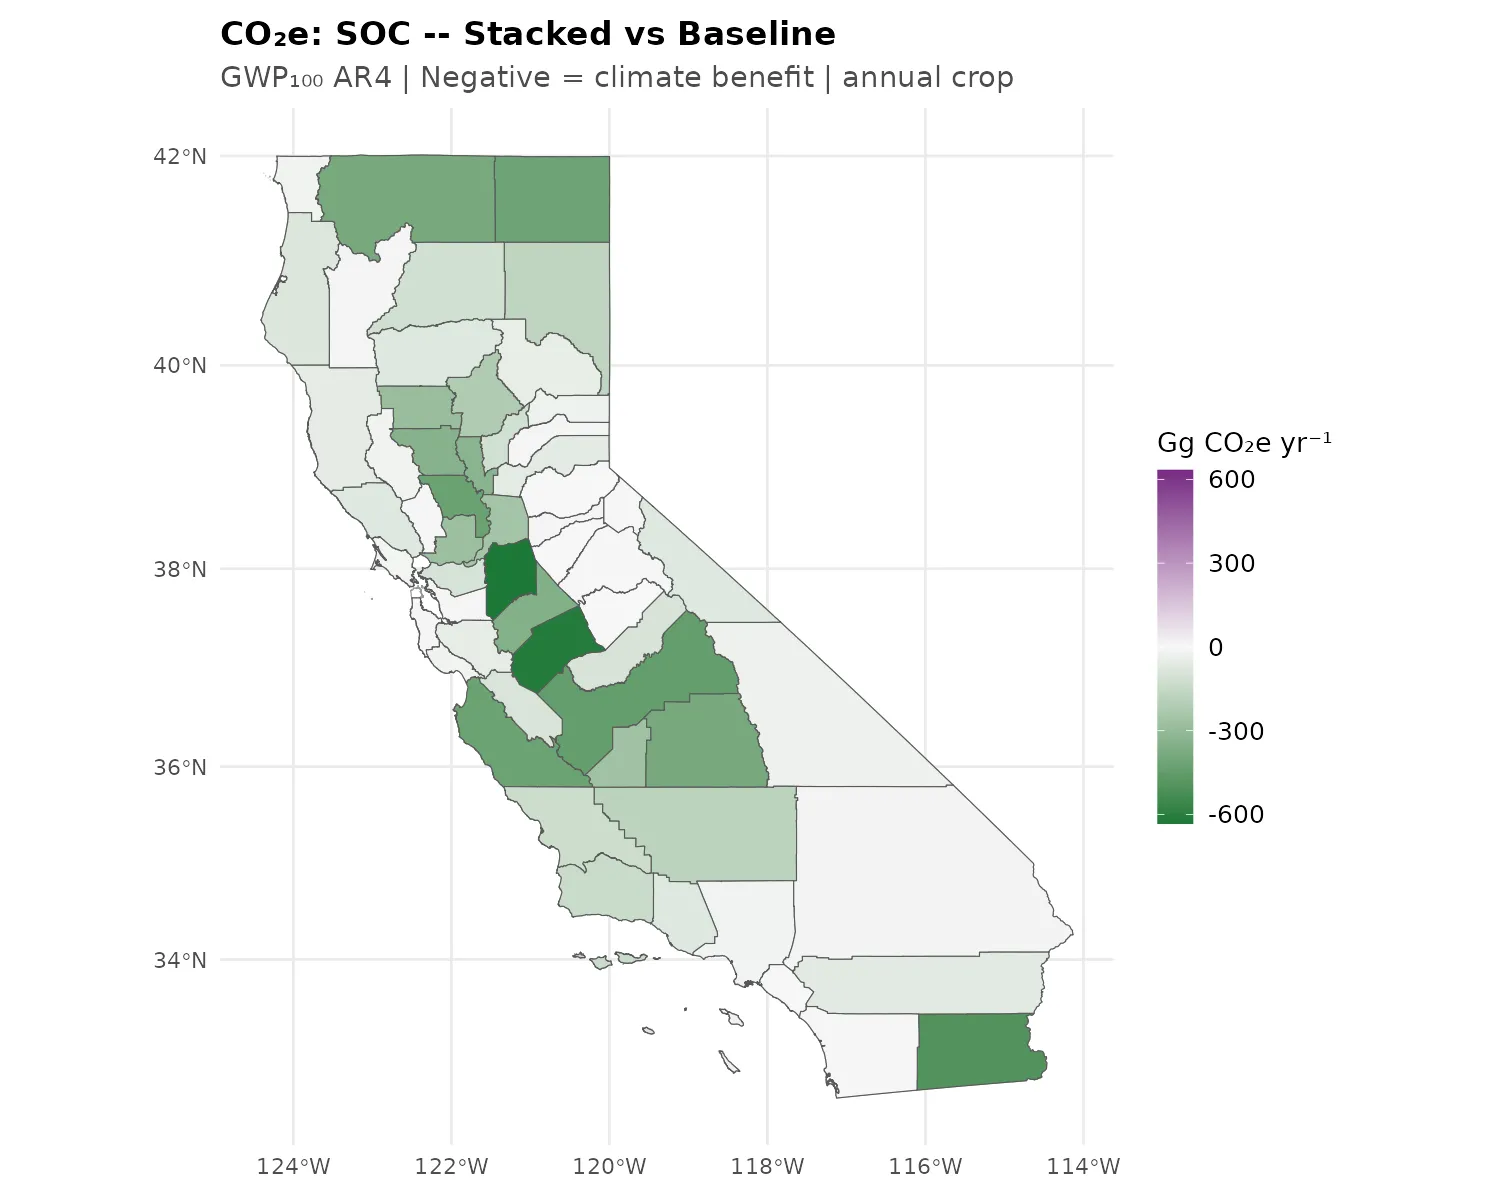
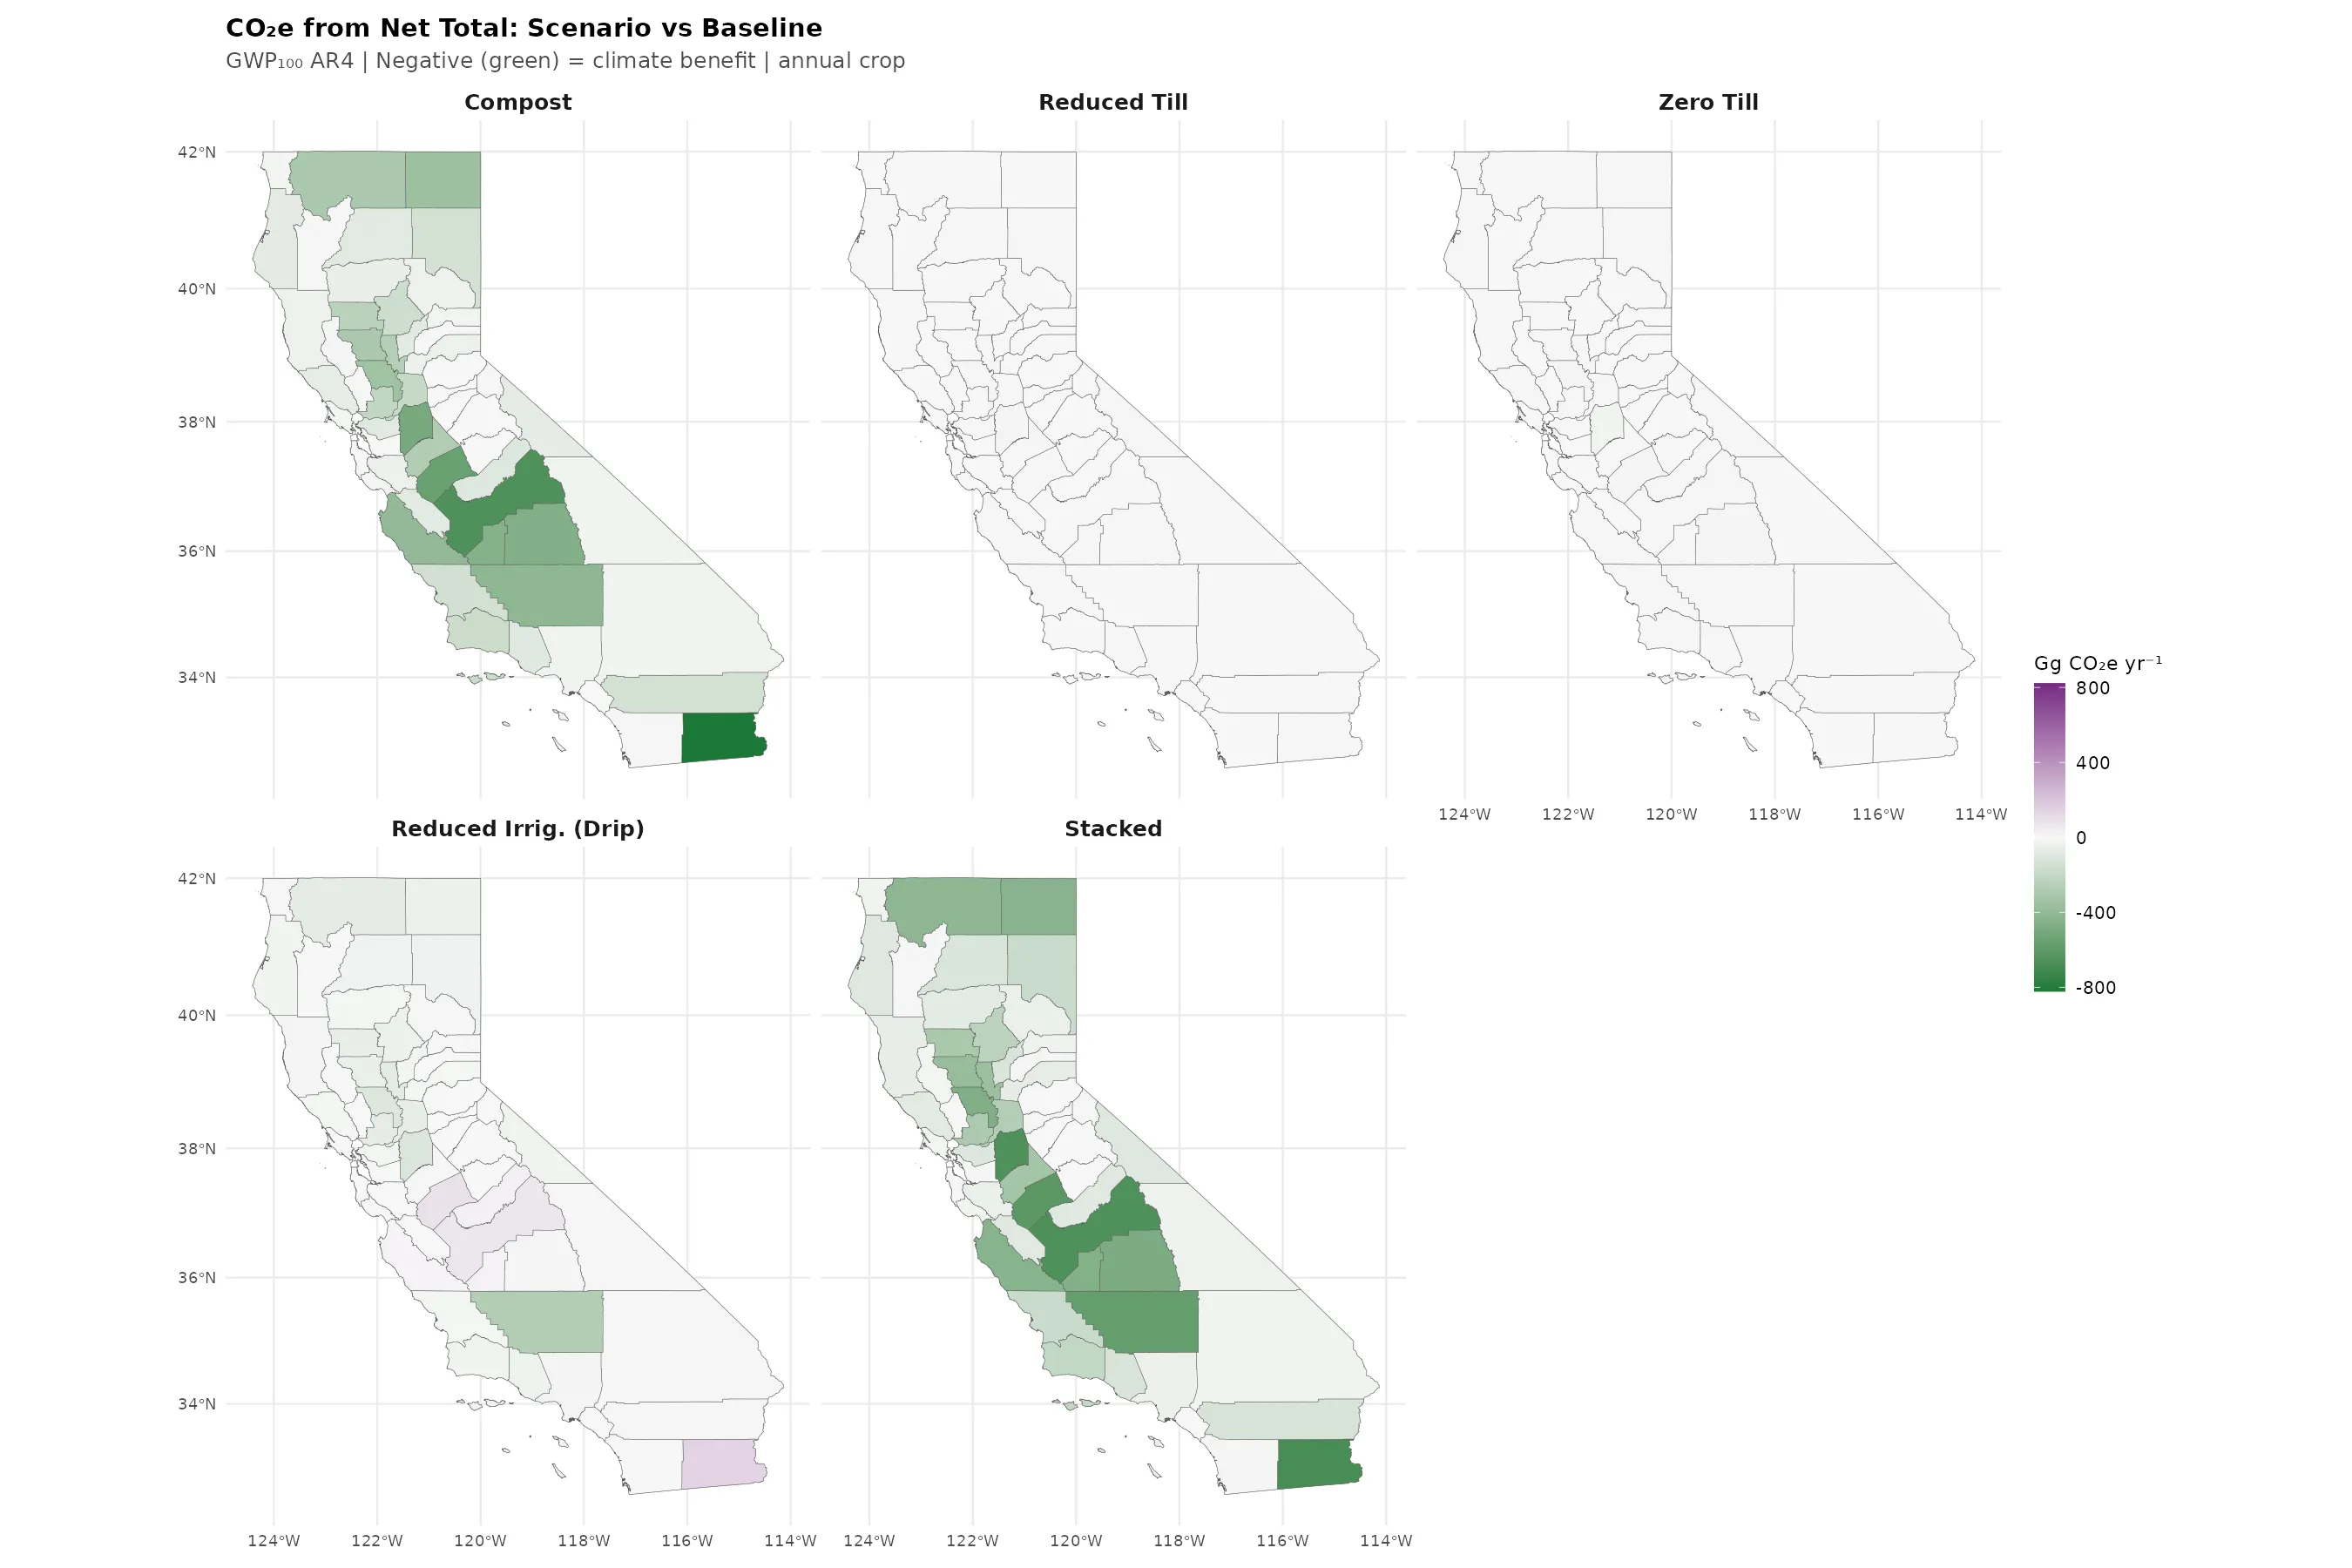
The maps below translate the GHG trade-offs into geographic patterns using GWP100 AR4 values. Green counties show net climate benefit (negative CO2e); purple counties show net climate cost (positive CO2e). Color scales are symmetric around zero and consistent across scenarios within each component.
SOC CO2e
N2O CO2e

Net CO2e
Note on GWP Version Sensitivity
All CO2e calculations in this atlas use GWP100 values from the IPCC Fourth Assessment Report (AR4, 2007): CH4 = 25, N2O = 298. More recent assessments report somewhat different values: AR5 (2013) uses CH4 = 28, N2O = 265; AR6 (2021) uses CH4 = 27.0, N2O = 273. Switching to AR5 or AR6 values would moderately reduce the estimated CO2e benefit from N2O reductions (by ~11%) and slightly increase the CH4 contribution (by ~12%). The qualitative conclusions – compost and stacked as the strongest net benefits, CH4 as negligible for non-flooded crops – hold across all three GWP versions.