| pft | n_pop | area_pop | pct_pop_n | pct_pop_area | n_design | pct_design |
|---|---|---|---|---|---|---|
| woody perennial crop | 215647 | 1683351 | 56 | 48.3 | 483 | 48.3 |
| annual crop | 169587 | 1802267 | 44 | 51.7 | 517 | 51.7 |
Design Point Validation
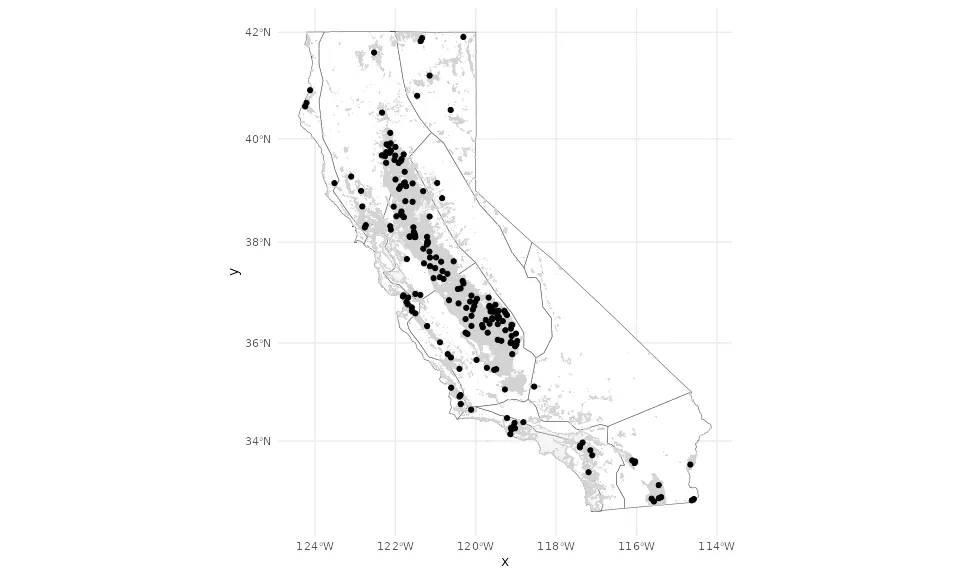
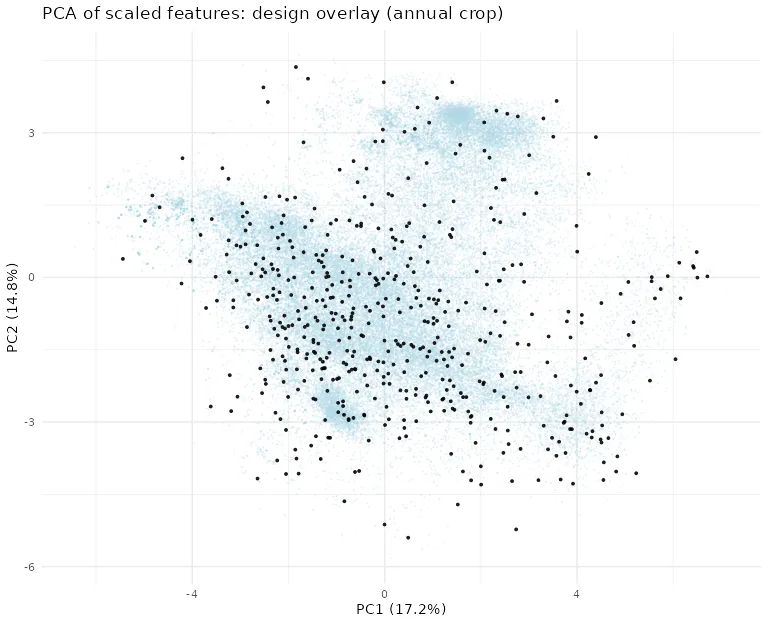
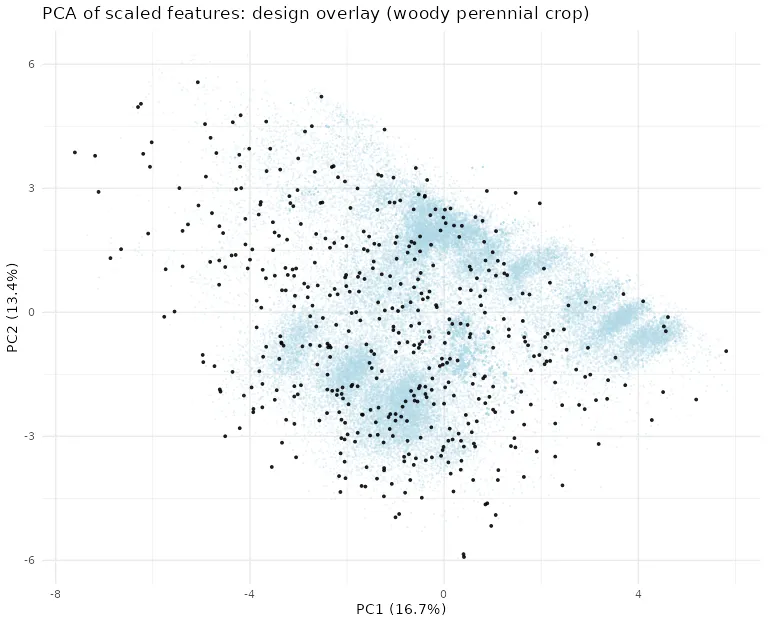
This report validates feature-space coverage of the selected design points relative to the statewide population. It does not determine the optimal number of SIPNET design points. The 1,000-site design evaluated here is selected from the 10,000-site candidate pool for demonstration.
Overview
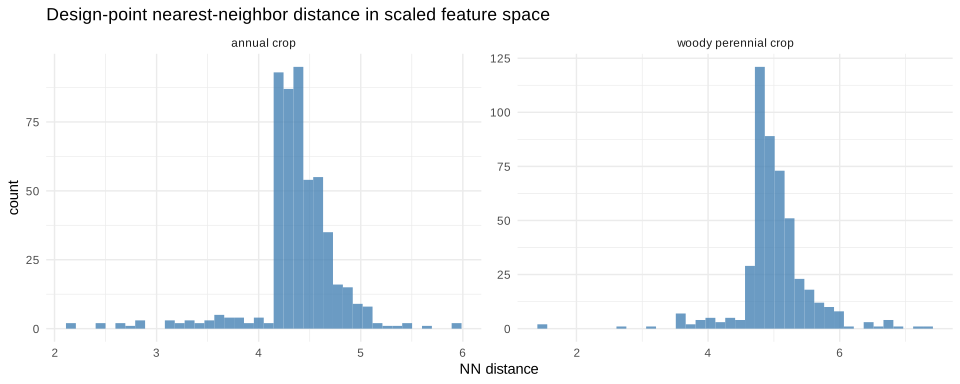
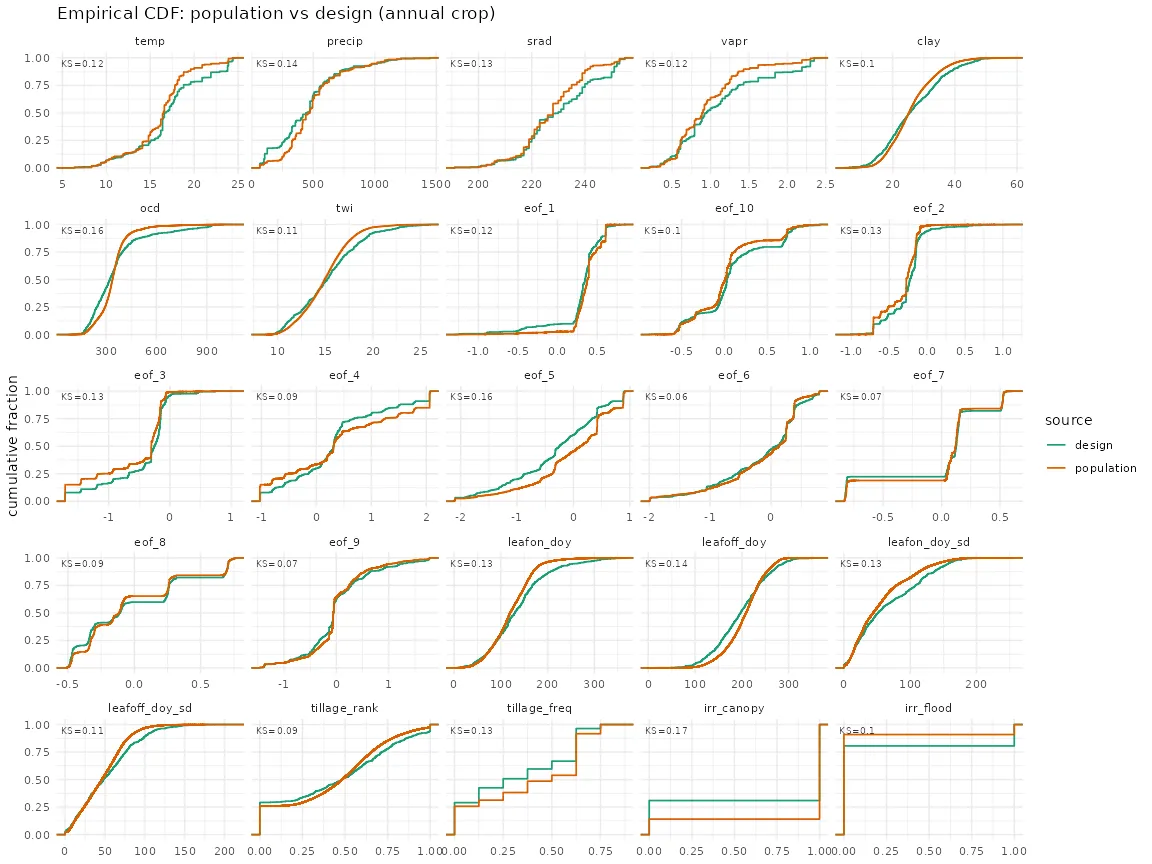
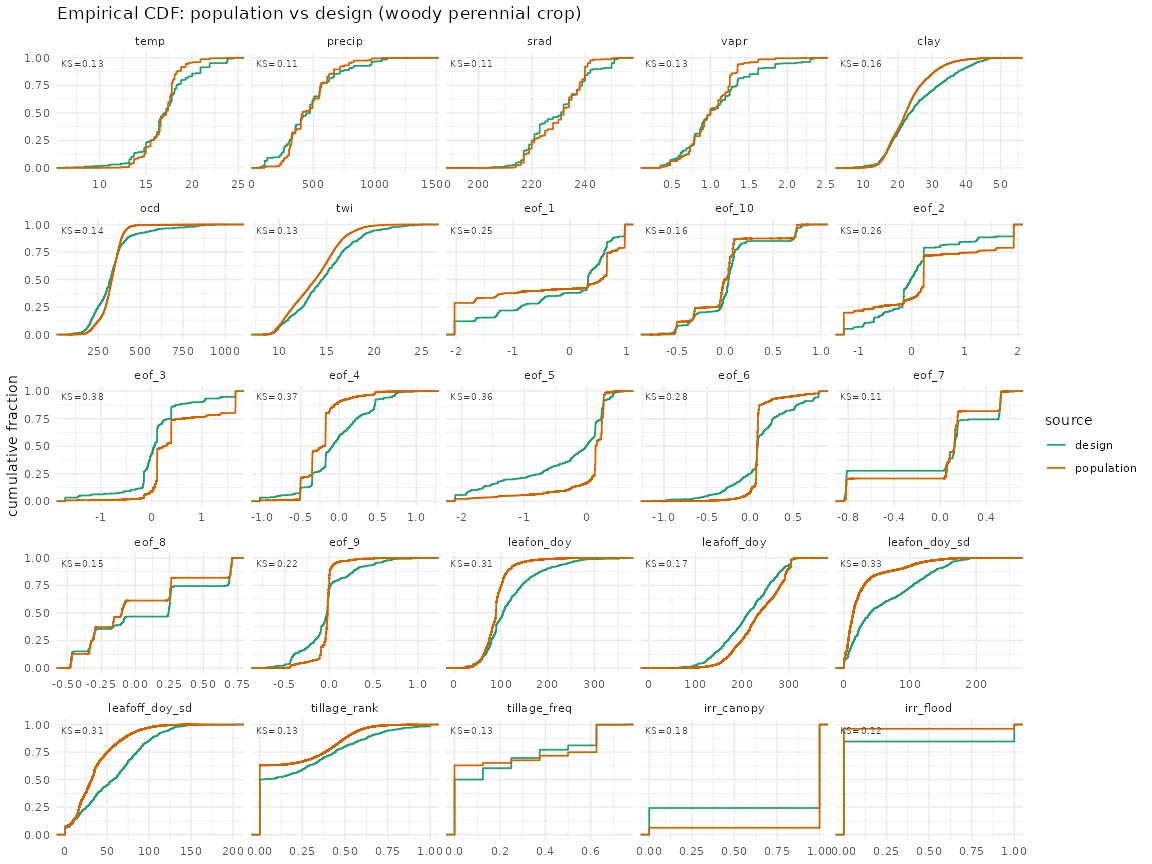
Design points are the field locations where SIPNET is run; a Random Forest then downscales those outputs to every cropland field in the CADWR LandIQ Crop Map. 020_cluster_sites.R clusters the population per plant functional type and keeps one representative per cluster as a 10,000-site candidate pool, 021_subsample_design_points.R draws the design from that pool by farthest point sampling, and 022_validate_design_points.R writes the tables and figures below. Coverage matters because the Random Forest predicts reliably only within the range of conditions the design spans, so gaps in covariate coverage become extrapolation.
Clustering uses seed 42 (020_cluster_sites.R).
PFT allocation
Population and design counts and area share per PFT.
Feature space coverage (MSSD, scaled)
Mean squared shortest distance from each population field to its nearest design point in scaled feature space. Lower is better coverage.
| pft | n_pop | n_design | mssd |
|---|---|---|---|
| annual crop | 169587 | 517 | 10.6549 |
| woody perennial crop | 215647 | 483 | 10.4718 |
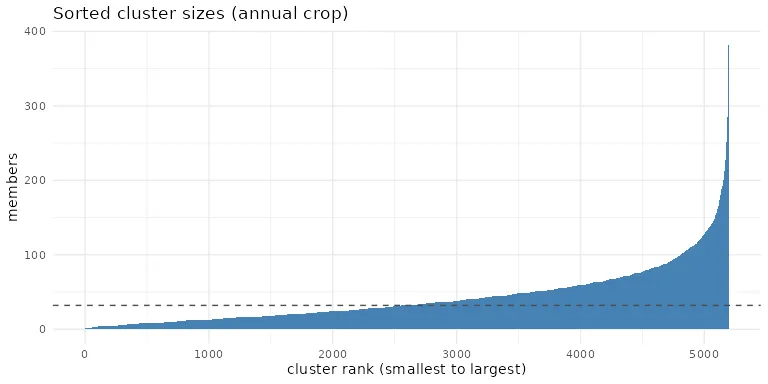
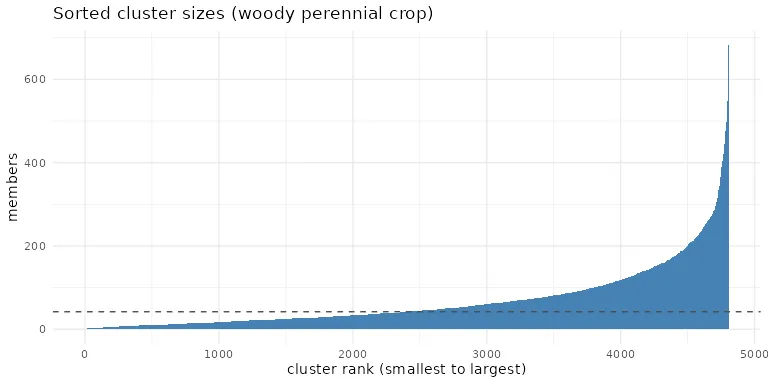
Cluster balance (Gini of cluster sizes)
| pft | n_clusters | min_size | median_size | max_size | gini |
|---|---|---|---|---|---|
| annual crop | 5171 | 1 | 25 | 335 | 0.436 |
| woody perennial crop | 4829 | 1 | 32 | 387 | 0.460 |
Anchor recovery
| n_anchors | in_design | missing |
|---|---|---|
| 27 | 27 | 0 |
Monitoring layer coverage
Share of the population and of the design carrying each management and phenology feature.
| feature | pop_n | pop_pct | design_n | design_pct |
|---|---|---|---|---|
| tillage_rank | 289392 | 75.1 | 766 | 76.6 |
| tillage_freq | 289780 | 75.2 | 773 | 77.3 |
| leafon_doy | 385234 | 100.0 | 1000 | 100.0 |
| leafoff_doy | 385234 | 100.0 | 1000 | 100.0 |
| leafon_doy_sd | 385234 | 100.0 | 1000 | 100.0 |
| leafoff_doy_sd | 385234 | 100.0 | 1000 | 100.0 |
| irr_canopy | 346937 | 90.1 | 709 | 70.9 |
| irr_flood | 26872 | 7.0 | 188 | 18.8 |
Climate region coverage
| climregion_id | n_pop | pct_pop | n_design | pct_design |
|---|---|---|---|---|
| 1 | 20607 | 5.3 | 59 | 5.9 |
| 2 | 15033 | 3.9 | 124 | 12.4 |
| 3 | 136802 | 35.5 | 263 | 26.3 |
| 4 | 3536 | 0.9 | 22 | 2.2 |
| 5 | 10454 | 2.7 | 33 | 3.3 |
| 6 | 4626 | 1.2 | 20 | 2.0 |
| 7 | 50600 | 13.1 | 125 | 12.5 |
| 8 | 29636 | 7.7 | 83 | 8.3 |
| 9 | 6351 | 1.6 | 33 | 3.3 |
| 10 | 1692 | 0.4 | 13 | 1.3 |
| 11 | 105897 | 27.5 | 225 | 22.5 |
Figures