Scenario-Based Analysis
Soil Carbon and Annual Nitrous-Oxide Results, 2024–2045
The scenario-based analysis compares four scenarios through December 2045. The reference uses business-as-usual management, CESM2 climate, and SSP370. Each alternative changes one dimension relative to the reference.
| Scenario | Management | Climate model | Pathway | Purpose |
|---|---|---|---|---|
| Reference | BAU | CESM2 | SSP370 | Reference scenario |
| Management | NBS | CESM2 | SSP370 | Management comparison |
| Climate model | BAU | MPI-ESM1-2-HR | SSP370 | Climate-model sensitivity |
| Pathway | BAU | CESM2 | SSP585 | Emissions-pathway sensitivity |
Soil-carbon context
| Measure | Annual crops | Woody perennial crops | Total |
|---|---|---|---|
| Inventory: December 2023 stock | 113.22 | 87.93 | 201.15 |
| Inventory: January 2016 to December 2023 change | -18.66 | -18.50 | -37.16 |
| Reference scenario: January 2024 stock | 124.96 | 95.84 | 220.80 |
| Reference scenario: January 2024 to December 2045 change | -30.52 | -14.81 | -45.33 |
The negative reference-scenario change may include adjustment from a non-stable initial state. Scenario effects are therefore evaluated primarily as matched differences from the reference trajectory.
Scenario effects relative to the reference
| Contrast | Annual crops | Woody perennial crops | Statewide mean | Statewide p05–p95 |
|---|---|---|---|---|
| Management minus reference | 0.73 | 0.83 | 1.55 | -1.81 to 3.86 |
| Climate model minus reference | 0.36 | -0.77 | -0.41 | -5.06 to 3.84 |
| Pathway minus reference | -1.85 | -1.87 | -3.71 | -6.16 to -1.31 |
Management retains an average of 1.55 Tg C more than the reference trajectory by December 2045. Changing the climate model produces little change in the statewide mean but different annual- and woody-crop responses. SSP585 reduces soil carbon by an additional 3.71 Tg C relative to the reference.
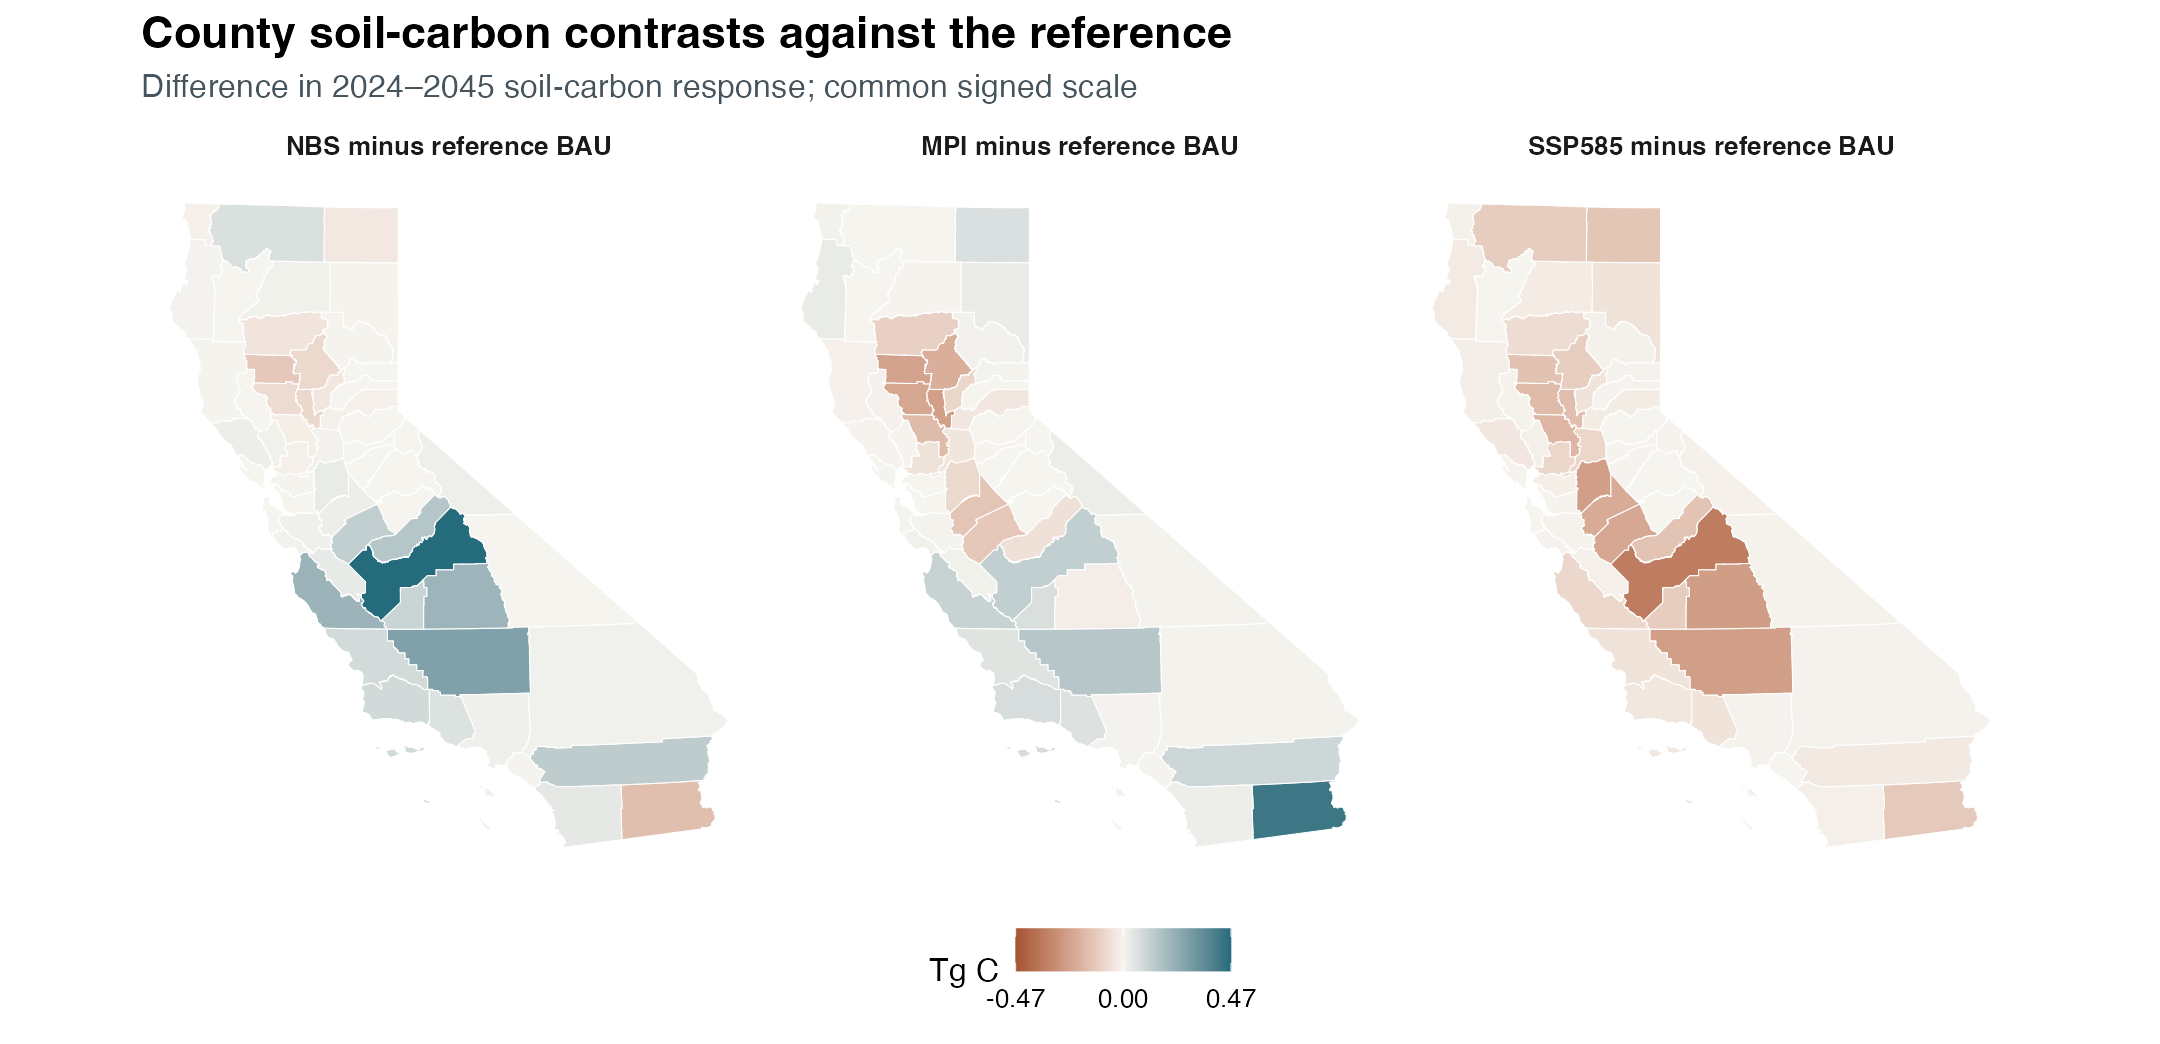
Scenario soil-carbon responses
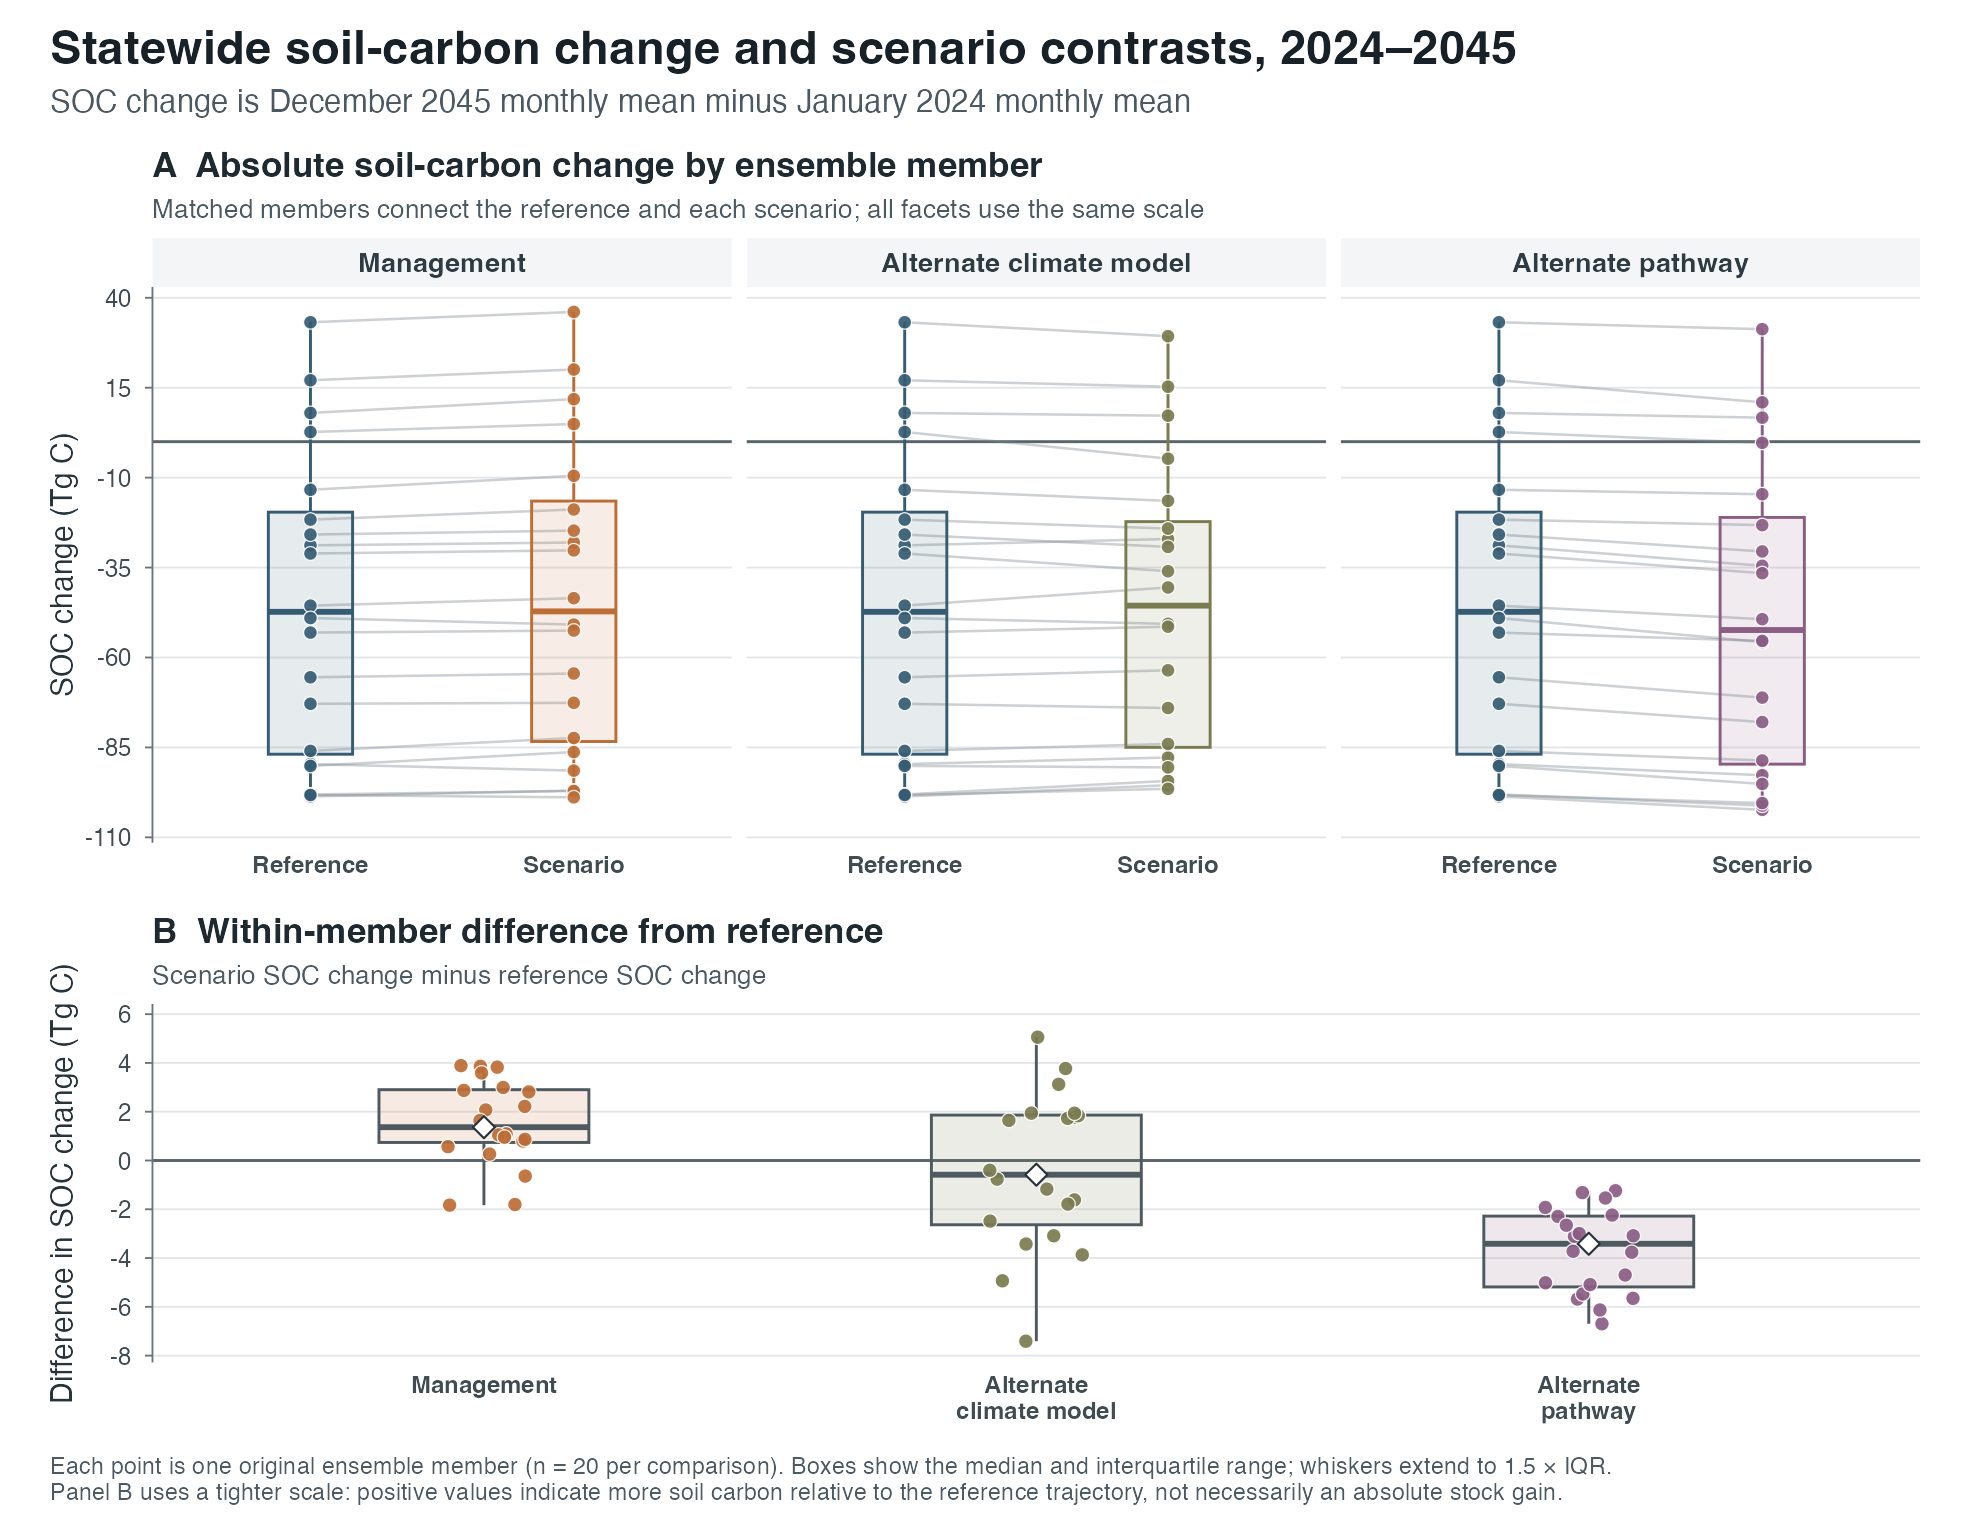
| Scenario | Mean | p05 | p95 |
|---|---|---|---|
| Reference | -45.33 | -98.26 | 17.87 |
| Management | -43.77 | -97.21 | 20.86 |
| Climate model | -45.74 | -95.55 | 15.98 |
| Pathway | -49.04 | -101.24 | 11.96 |
Annual N2O-N
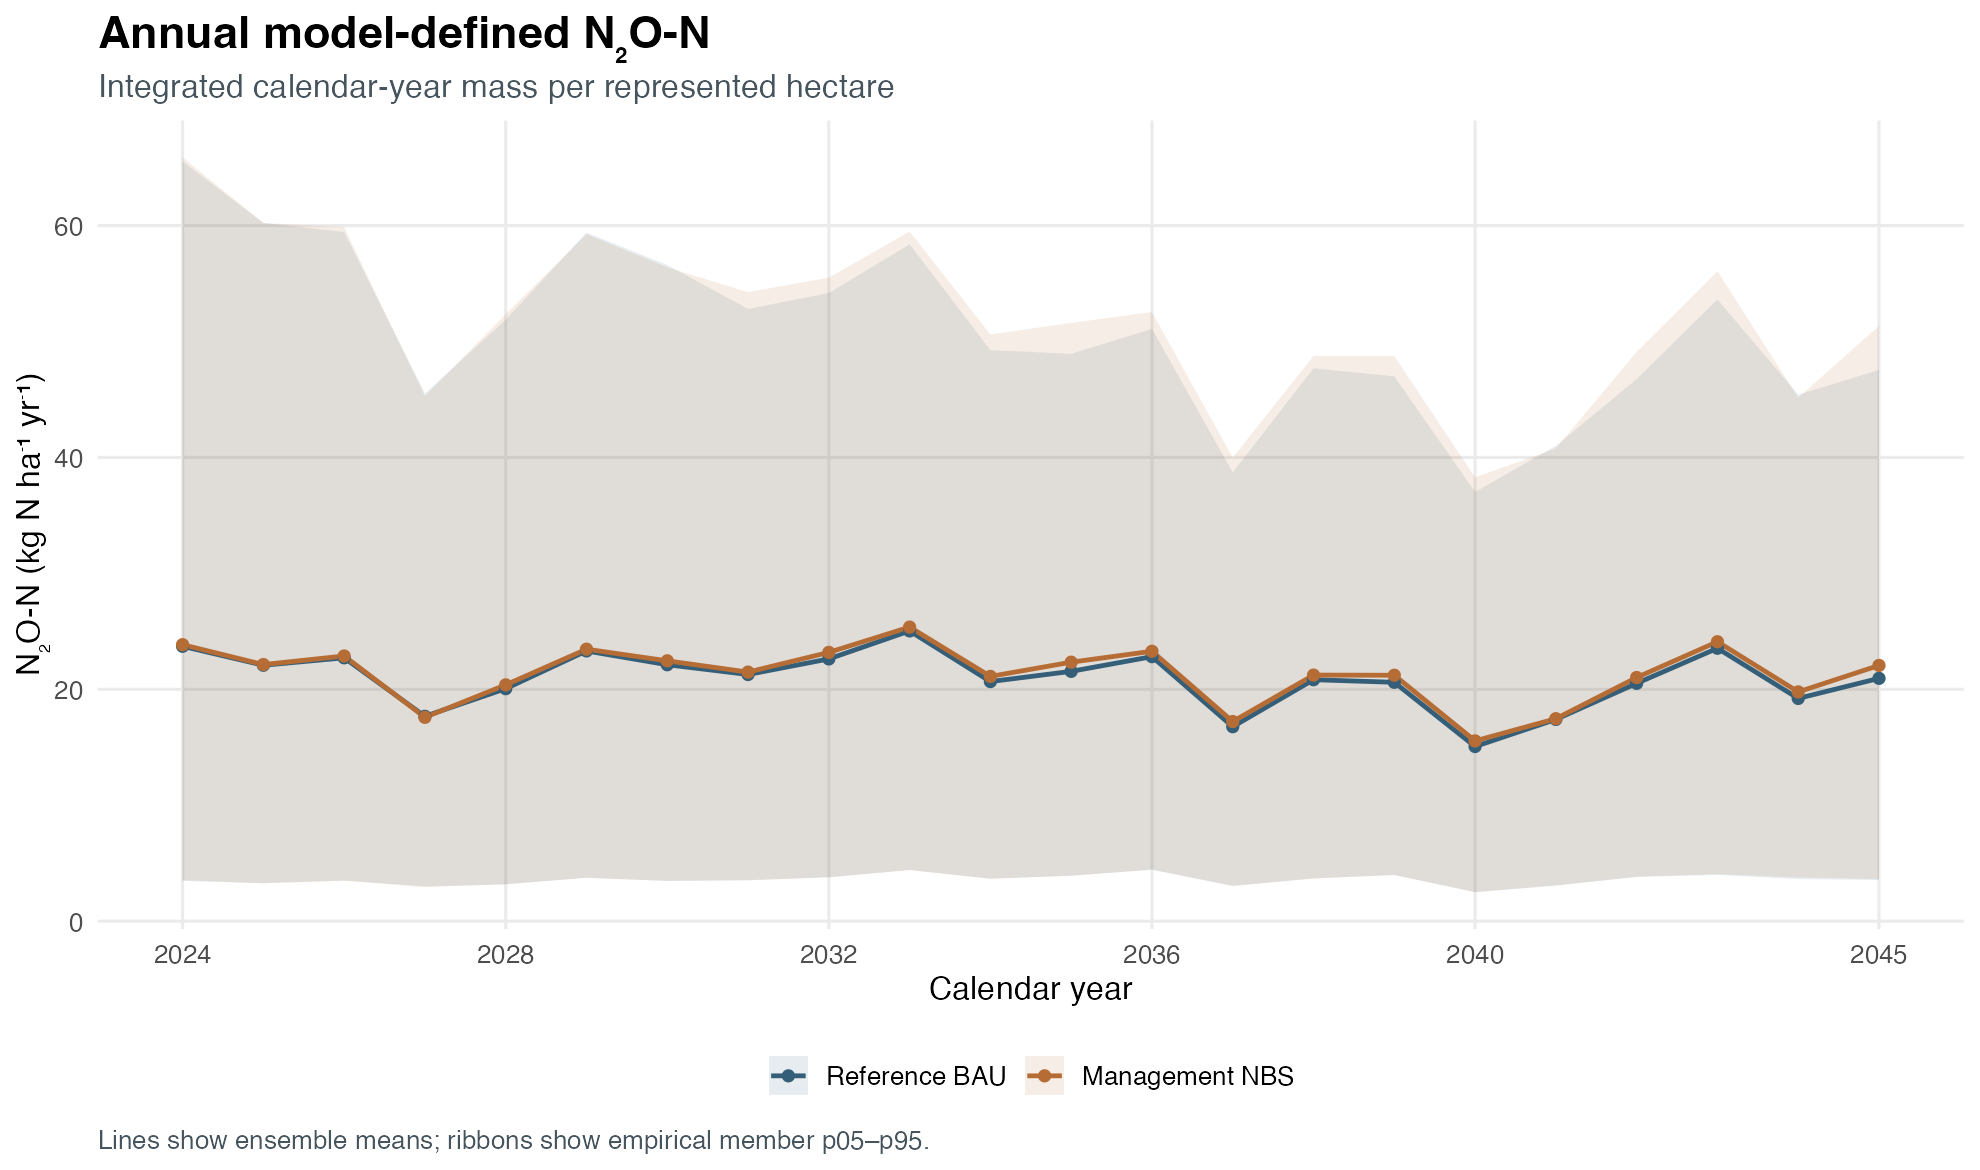
Scenario N2O-N is integrated over each calendar year and reported in kg N ha-1 yr-1. The current annual comparison covers the reference and management scenarios; it is an interim two-scenario result rather than the finalized four-scenario annual-gas product.
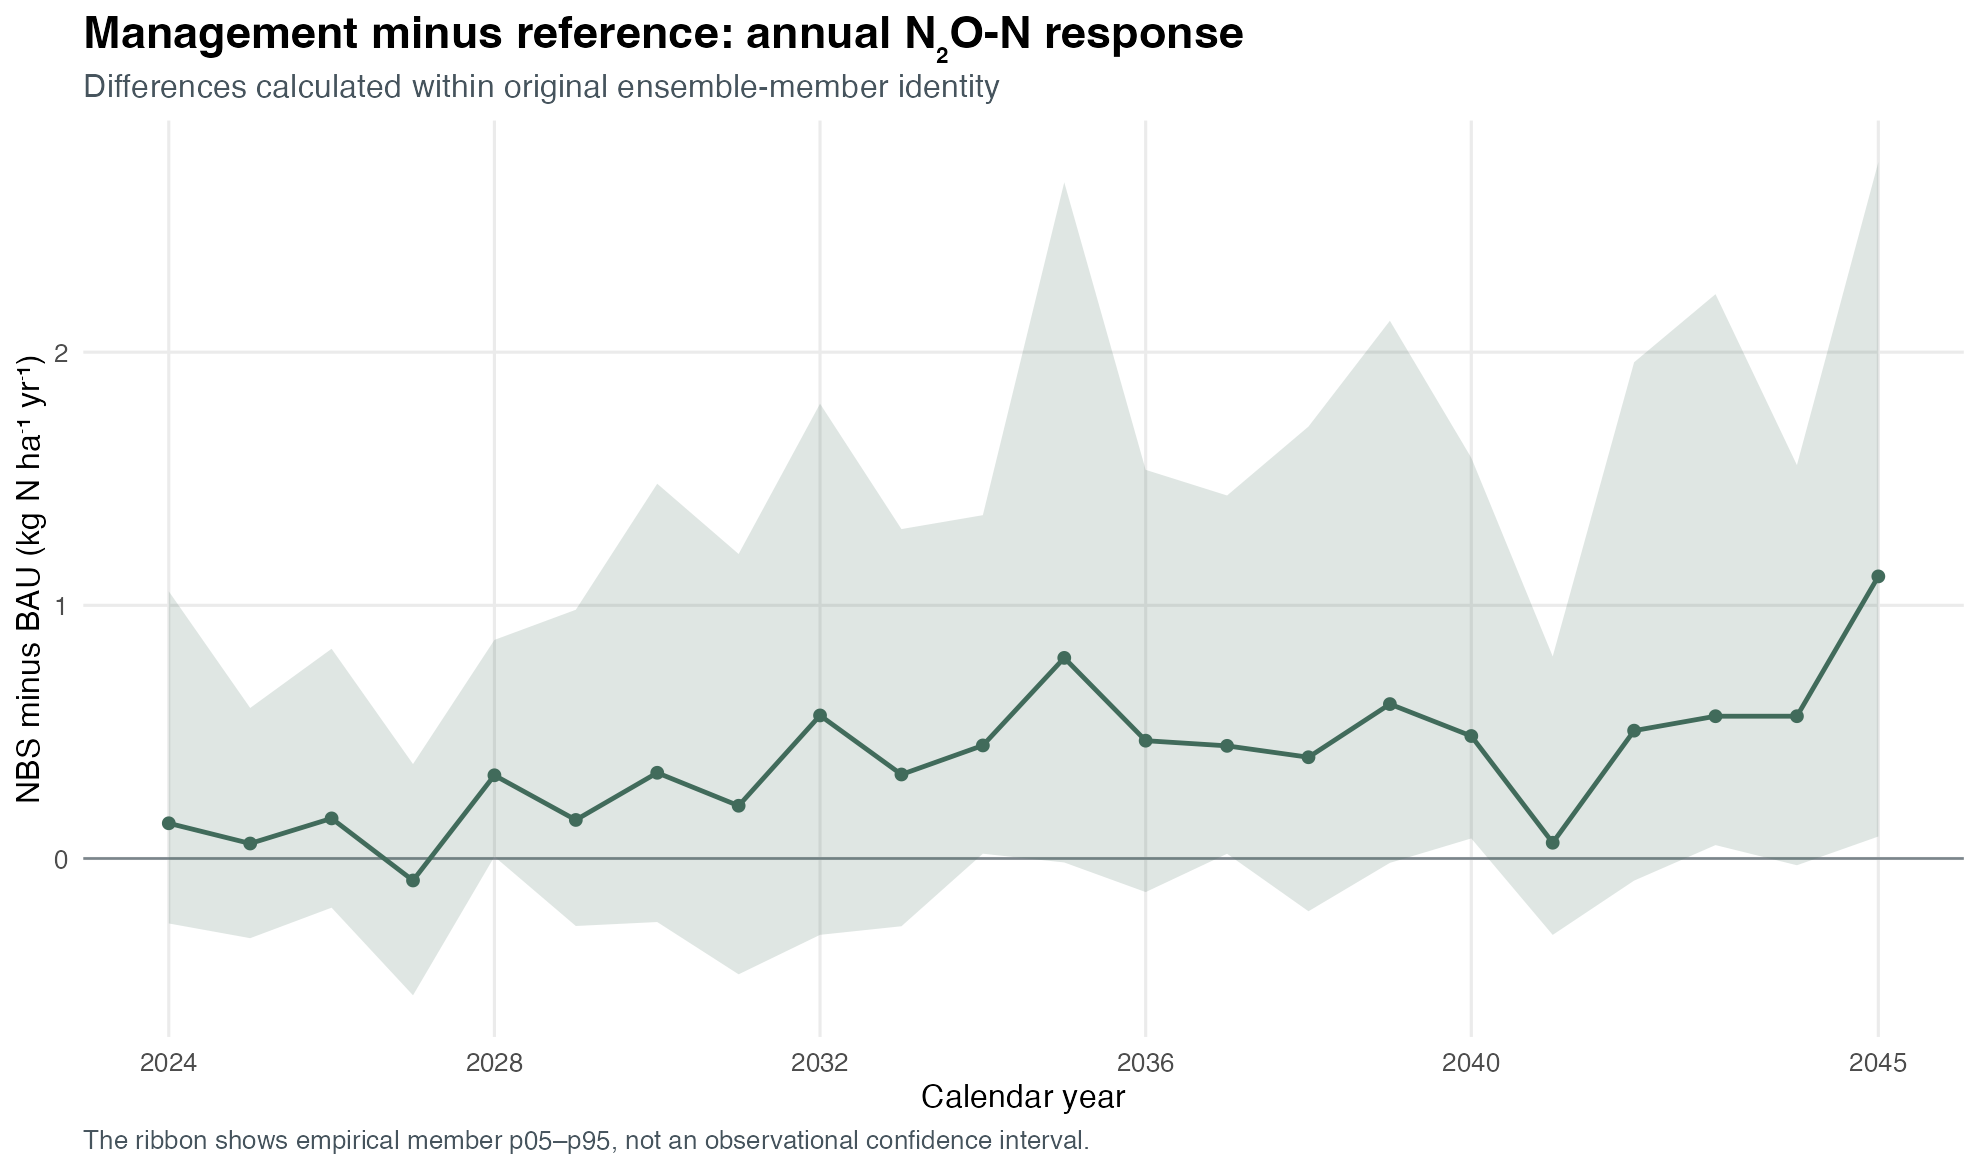
| Year | Reference | Management | Management minus reference |
|---|---|---|---|
| 2024 | 23.71 | 23.85 | 0.14 |
| 2030 | 22.12 | 22.46 | 0.34 |
| 2035 | 21.55 | 22.34 | 0.79 |
| 2040 | 15.06 | 15.55 | 0.48 |
| 2045 | 20.95 | 22.06 | 1.11 |
The management mean is higher than the reference in most years, although the same-member range commonly crosses zero. Methane is not shown here; methane analysis will focus on crop fields with at least one rice season.